
10 Chapter 10: Mendel’s Peas and Punnett Squares
Lisa Limeri; Joshua Reid; rocksher; and Shifath Bin Syed
Learning Objectives
By the end of this section, you will be able to do the following:
- Given a dominance pattern of alleles, infer phenotypes when given genotypes and vice-versa.
- Label which elements in a Punnett square represent the genotypes of egg, sperm, and offspring.
- Given any pair of parental genotypes and information on the alleles present, use a Punnett square to complete a genetic cross. Identify the genotypes and phenotypes of offspring and calculate their predicted frequencies.
Introduction
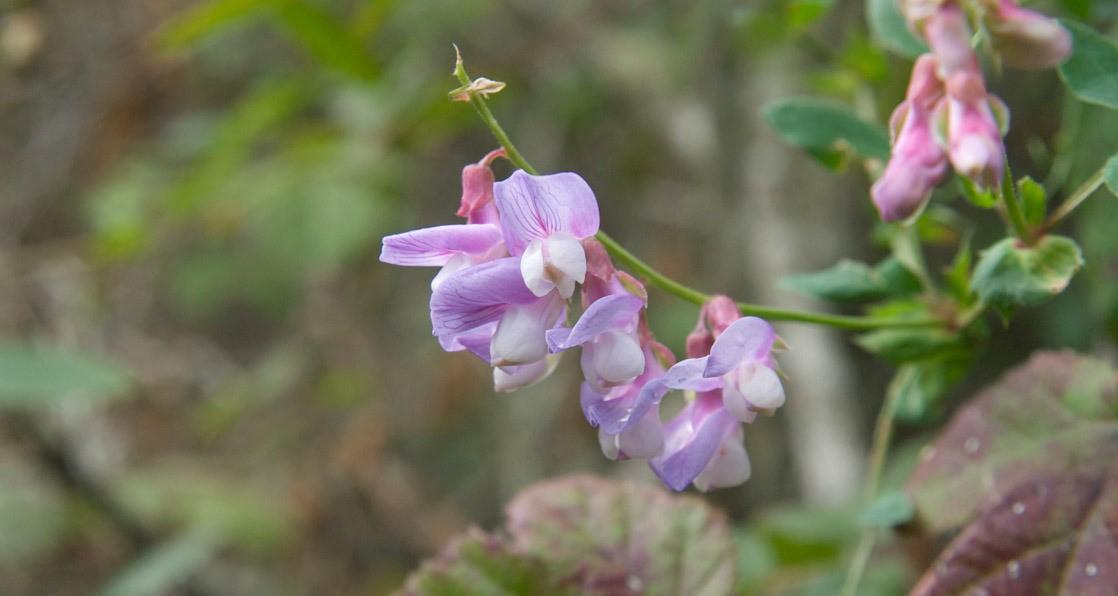
Genetics is the study of heredity. Gregor Mendel set the framework for genetics long before chromosomes or genes were identified when meiosis was not well understood. Mendel selected a simple biological system and conducted methodical, quantitative analyses using large samples of garden pea plants (Fig. 10.1). Because of Mendel’s work, the fundamental principles of heredity were revealed. We now know that genes, carried on chromosomes, are the basic functional units of heredity that can be replicated, expressed, or mutated. Today, the postulates put forth by Mendel form the basis of classical, or Mendelian, genetics. Not all traits follow the simple principles of inheritance according to Mendelian genetics, but Mendel’s experiments serve as an excellent starting point for thinking about inheritance.
Mendel’s Experiments and the Laws of Probability
Gregor Mendel (1822–1884) was a monk in what is now the Czech Republic. He taught physics, botany, and natural science courses at the secondary and university levels. In 1856, he began a decade-long research investigating inheritance patterns in honeybees and plants, ultimately settling on pea plants as his primary model system. In 1865, Mendel presented the results of his experiments with nearly 30,000 pea plants to the local Natural History Society. He demonstrated that traits are transmitted from parents to offspring independently of other traits and in dominant and recessive patterns. In 1865, he published his work, Experiments in Plant Hybridization, in the proceedings of the Natural History Society of Brünn (Mendel, 1865).
Mendel’s work went virtually unnoticed by the scientific community, which incorrectly believed that the inheritance process involved a blending of parental traits that produced an intermediate physical appearance in offspring. The blending theory of inheritance asserted that the original parental traits were lost or absorbed by the blending in the offspring, but we now know this is not the case. This hypothetical process appeared correct because of what we now know as a continuous variation. Continuous variation results from the action of many genes to determine a characteristic like human height. Offspring appear to be a “blend” of their parents’ traits.
Instead of continuous characteristics, Mendel worked with traits that were inherited in distinct classes (e.g., purple versus white flowers). Mendel’s choice of these traits allowed him to experimentally see that the traits were not blended in the offspring, nor were they absorbed, but rather that they kept their distinctness and could be passed on.
Mendel’s Model System
Mendel studied inheritance using the garden pea, Pisum sativum. This species naturally self-fertilizes, such that pollen encounters ova within individual flowers. The flower petals remain sealed tightly until after pollination, preventing pollination from other plants. The result is highly inbred, or “true-breeding,” pea plants. These are plants that always produce offspring that look like their parents. By experimenting with true-breeding pea plants, Mendel avoided the appearance of unexpected traits in offspring that might occur if the plants were not true breeding. The garden pea also grows to maturity within one season, meaning that several generations could be evaluated over a relatively short time. Finally, large quantities of garden peas could be cultivated simultaneously, allowing Mendel to conclude that his results did not come about simply by chance.
Mendelian Crosses
Mendel performed hybridizations, which involved mating two true-breeding individuals with different traits. In the pea, which is naturally self-pollinating, this is done by manually transferring pollen from the anther of a mature pea plant of one variety to the stigma of a separate mature pea plant of a different variety. In plants, pollen carries the male gametes (sperm) to the stigma, a sticky organ that traps pollen and allows the sperm to move down the pistil to the female gametes (ova) below. To prevent the pea plant that was receiving pollen from self-fertilizing and confounding his results, Mendel painstakingly removed all of the anthers from the plant’s flowers before they could mature.
Plants used in first-generation crosses were called P, or parental generation (Figure 10.2). After each cross, Mendel collected the seeds belonging to the parental generation plants and grew them the following season. These offspring were called the F1 or the first filial (filial = offspring) generation. Once Mendel examined the characteristics of the F1 generation of plants, he allowed them to self-fertilize naturally. He then collected and grew the seeds from the F1 plants to produce the F2 (second filial) generation. Mendel’s experiments extended beyond the F2 generation to the F3 and F4 generations, and so on, but it was the ratio of characteristics in the P−F1−F2 generations that were the most intriguing and became the basis for Mendel’s postulates.
Garden Pea Characteristics Revealed the Basics of Heredity
In his 1865 publication, Mendel reported the results of his crosses involving seven different characteristics, each with two contrasting traits. A trait is defined as a variation in the physical appearance of a heritable characteristic. The characteristics included plant height, seed texture, seed color, flower color, pea pod size, pea pod color, and flower position. For the characteristic of flower color, for example, the two contrasting traits were white versus purple. To fully examine each characteristic, Mendel generated large numbers of F1 and F2 plants, reporting results from 19,959 F2 plants alone. His findings were consistent.
What results did Mendel find in his crosses for flower color? First, Mendel confirmed that he had plants that bred true for white or purple flower color. Regardless of how many generations Mendel examined, all self-crossed offspring of parents with white flowers had white flowers, and all self-crossed offspring of parents with purple flowers had purple flowers. In addition, Mendel confirmed that other than flower color, the pea plants were physically identical.
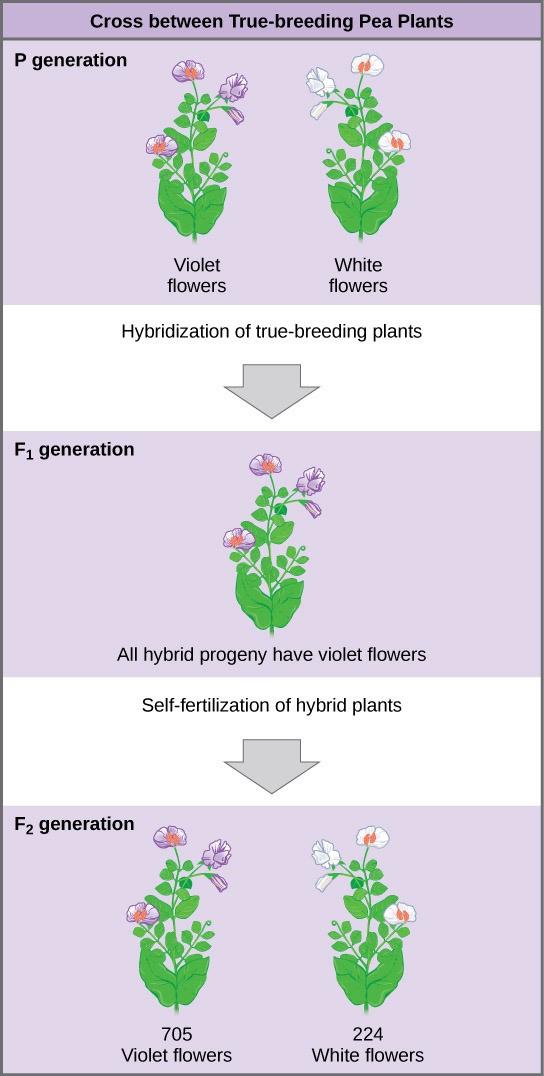
Once these validations were complete, Mendel applied the pollen from a plant with purple flowers to the stigma of a plant with white flowers. After gathering and sowing the seeds that resulted from this cross, Mendel found that 100% of the F1 hybrid generation had purple flowers. Conventional wisdom at that time (the blending theory) would have predicted the hybrid flowers to be pale purple or for hybrid plants to have equal numbers of white and purple flowers. In other words, the contrasting parental traits were expected to blend in with the offspring. Instead, Mendel’s results demonstrated that the white flower trait in the F1 generation had completely disappeared.
Importantly, Mendel did not stop his experimentation there. He allowed the F1 plants to self-fertilize and found that, of the F2-generation plants, 705 had purple flowers and 224 had white flowers. This was a ratio of 3.15 purple flowers per one white flower, or approximately 3:1. When Mendel transferred pollen from a plant with purple flowers to the stigma of a plant with white flowers and vice versa, and he obtained about the same ratio regardless of which parent, male or female, contributed which trait. This is called a reciprocal cross—a paired cross in which the respective traits of the male and female in one cross become the respective traits of the female and male in the other cross. For the other six characteristics Mendel examined, the F1 and F2 generations behaved in the same way as they had for flower color. One of the two traits would disappear completely from the F1 generation only to reappear in the F2 generation at a ratio of approximately 3:1 (Table 10.1).
Table 10.1. The Results of Mendel’s Garden Pea Hybridizations
|
Characteristic |
Contrasting P0 Traits |
F1 Offspring Traits |
F2 Offspring Traits |
F2 Trait Ratios |
|
Flower color |
purple vs. white |
100 percent purple |
705 purple, 224 white |
3.15:1 |
|
Flower position |
Axial vs. terminal |
100 percent axial |
651 axial, 207 terminal |
3.14:1 |
|
Plant height |
Tall vs. short |
100 percent tall |
787 tall, 277 dwarf |
2.84:1 |
|
Seed texture |
Round vs. wrinkled |
100 percent round |
5,474 rounds, 1,850 wrinkled |
2.96:1 |
|
Seed color |
Yellow vs. green |
100 percent yellow |
6,022 yellow, 2,001 green |
3.01:1 |
|
Pea pod texture |
Inflated vs. constricted |
100 percent inflated |
882 inflated, 299 constricted |
2.95:1 |
|
Pea pod color |
Green vs. Yellow |
100 percent green |
428 green 152 yellow |
2.82:1 |
Upon compiling his results for many thousands of plants, Mendel concluded that the characteristics could be divided into dominant and recessive traits. Dominant traits are those that are inherited unchanged in a hybridization. Recessive traits become latent or disappear in the offspring of a hybridization. The recessive trait does, however, reappear in the progeny of the hybrid offspring. An example of a dominant trait is the purple-flower trait. White-colored flowers are a recessive trait for this same characteristic (flower color). The fact that the recessive trait reappeared in the F2 generation meant that the traits remained separate (not blended) in the plants of the F1 generation. Mendel also proposed that plants possessed two copies of the trait for the flower-color characteristic and that each parent transmitted one of its two copies to its offspring, where they came together. Moreover, the physical observation of a dominant trait could mean that the genetic composition of the organism included two dominant versions of the character or that it included one dominant and one recessive version. Conversely, observing a recessive trait meant that the organism lacked any dominant versions of this characteristic.
Reading Question #1
According to Mendel’s experiments with garden peas, what was the ratio of purple flowers to white flowers in the F2 generation?
A. 3:1
B. 2.84:1
C. 3.15:1
D. 2.95:1
So why did Mendel repeatedly obtain 3:1 ratios in his crosses? To understand how Mendel deduced the basic mechanisms of inheritance that led to such ratios, we must first review the laws of probability.
Probability Basics
Probabilities are mathematical measures of likelihood. The empirical probability of an event is calculated by dividing the number of times the event occurs by the total number of opportunities for the event to occur. A probability of 1 for some event indicates that it is guaranteed to occur, whereas a probability of 0 indicates that it is guaranteed not to occur.
In one experiment, Mendel demonstrated that the probability of a plant producing offspring with the round seed trait occurring was 1 in the F1 offspring of a cross of round-seed and wrinkled-seed true-breeding parents. When the F1 plants were subsequently self-crossed, the probability of any given F2 offspring having round seeds was now 3 out of 4. In other words, in a large population of F2 offspring chosen at random, 75% were expected to have round seeds, whereas 25% were expected to have wrinkled seeds. Using large numbers of crosses, Mendel was able to calculate probabilities and use these to predict the outcomes of other crosses.
The Product Rule and Sum Rule
Mendel demonstrated that pea plants transmit characteristics as discrete units from parent to offspring. As we will explore next, Mendel also determined that different characteristics, like seed color and seed texture, were transmitted independently of one another and could be considered in separate probability analyses. For instance, performing a cross between a plant with green, wrinkled seeds and a plant with yellow, round seeds still produced offspring that had a 3:1 ratio of yellow: green seeds (ignoring seed texture) and a 3:1 ratio of wrinkled: round seeds (ignoring seed color). The characteristics of color and texture did not influence each other.
The product rule of probability can be applied to this phenomenon of the independent transmission of characteristics. The product rule states that the probability of two independent events occurring together can be calculated by multiplying the individual probabilities of each event occurring alone. To demonstrate the product rule, imagine that you are rolling a six-sided die (D) and flipping a penny (P) simultaneously. The die may roll any number from 1–6 (D#), whereas the penny may turn up heads (PH) or tails (PT). The outcome of rolling the die does not affect the outcome of flipping the penny, and vice versa. There are 12 possible outcomes of this action (Table 10.2), and each event is expected to occur with equal probability.
Table 10.2 Twelve Equally Likely Outcomes of Rolling a Die and Flipping a Penny
|
Rolling Die |
Flipping Penny |
|
D1 |
PH |
|
D1 |
PT |
|
D2 |
PH |
|
D2 |
PT |
|
D3 |
PH |
|
D3 |
PT |
|
D4 |
PH |
|
D4 |
PT |
|
D5 |
PH |
|
D5 |
PT |
|
D6 |
PH |
|
D6 |
PT |
Of the 12 possible outcomes, the die has a 2/12 (or 1/6) probability of rolling a two, and the penny has a 6/12 (or 1/2) probability of coming up heads. By the product rule, the probability that you will obtain the combined outcome of two and heads is (D2) x (PH) = (1/6) x (1/2) or 1/12 (Table 10.3). Notice the word “and” in the description of the probability. The “and” is a signal to apply the product rule. For example, consider how the product rule is applied to the dihybrid cross: the probability of having both dominant traits (for example, yellow and round) in the F2 progeny is the product of the probabilities of having the dominant trait for each characteristic, as shown here:
 ×
× =
=
On the other hand, the sum rule of probability is applied when considering two mutually exclusive outcomes that can come about through more than one pathway. The sum rule states that the probability of the occurrence of one event or the other event of two mutually exclusive events is the sum of their individual probabilities. Notice the word “or” in the description of the probability. The “or” indicates that you should apply the sum rule. Let’s imagine you are flipping a penny (P) and a quarter (Q). What is the probability of one coin coming up heads and one coin coming up tails? This outcome can be achieved in two cases: the penny may be heads (PH), and the quarter may be tails (QT), or the quarter may be heads (QH), and the penny may be tails (PT). Either case fulfills the outcome. By the sum rule, we calculate the probability of obtaining one head and one tail as [(PH) × (QT)] + [(QH) × (PT)] = [(1/2) × (1/2)] + [(1/2) × (1/2)] = 1/2 (Table 10.3). You should also notice that we used the product rule to calculate the probability of PH and QT, and also the probability of PT and QH, before we summed them. Again, the sum rule can be applied to show the probability of having at least one dominant trait in the F2 generation of a dihybrid cross:
( ×
× )+(
)+( ×
× ) =
) =  +
+ =
=  =
= 
Table 10.3 The Product Rule and Sum Rule
|
Product Rule |
Sum Rule |
|
For independent events A and B, the probability (P) of them both occurring (A and |
For mutually exclusive events A and B, the probability (P) that at least one occurs (A or B) |
|
B) is (PA × PB) |
is (PA + PB) |
To use probability laws in practice, we must work with large sample sizes because small sample sizes are prone to deviations caused by chance. The large quantities of pea plants that Mendel examined allowed him to calculate the probabilities of the traits appearing in his F2 generation. As you will learn, this discovery meant that when parental traits were known, the offspring’s traits could be predicted accurately even before fertilization.
Reading Question #2
Which probability rule states that the probability of two independent events occurring together can be calculated by multiplying the individual probabilities of each event occurring alone?
A. The Product Rule
B. The Sum Rule
C. The Empirical Rule
D. The Independent Rule
Characteristics and Traits
In cases where a single gene controls a single characteristic, a diploid organism has two genetic copies that may or may not encode the same version of that characteristic. Gene variants that arise by mutation and exist at the same relative locations on homologous chromosomes are called alleles. Mendel examined the inheritance of genes with just two allele forms, but it is common to encounter more than two alleles for any given gene in a natural population.
Several conventions exist for referring to genes and alleles. For the purposes of this chapter, we will abbreviate genes using the first letter of the gene’s corresponding dominant trait. For example, purple is the dominant trait for a pea plant’s flower color, so the flower-color gene would be abbreviated as P (note that it is customary to italicize gene designations). Furthermore, we will use uppercase and lowercase letters to represent dominant and recessive alleles, respectively. Therefore, we would refer to the genotype of a homozygous dominant pea plant with purple flowers as PP, a homozygous recessive pea plant with white flowers as pp, and a heterozygous pea plant with purple flowers as Pp.
The Punnett Square Approach for a Monohybrid Cross
When fertilization occurs between two true-breeding parents that differ in only one characteristic, the process is called a monohybrid cross (mono = one trait difference). Mendel performed seven monohybrid crosses involving contrasting traits for each characteristic. On the basis of his results in F1 and F2 generations, Mendel postulated that each parent in the monohybrid cross contributed one allele to each offspring, and every possible combination of alleles was equally likely.
To demonstrate a monohybrid cross, consider the case of true-breeding pea plants with yellow versus green pea seeds. The dominant seed color is yellow; therefore, the parental genotypes were YY for the plants with yellow seeds and yy for the plants with green seeds, respectively. A Punnett square, devised by the British geneticist Reginald Punnett, can be drawn that applies the rules of probability to predict the possible outcomes of a genetic cross or mating and their expected frequencies (Fig 10.3). To prepare a Punnett square, all possible combinations of the parental allele combinations are listed along the top (for one parent) and side (for the other parent) of a grid, representing their meiotic segregation into haploid gametes. Then the combinations of egg and sperm are made in the boxes in the table to show which alleles are combining. Each box then represents the diploid genotype of a zygote, or fertilized egg, that could result from this mating. Because each possibility is equally likely, genotypic ratios can be determined from a Punnett square. If the pattern of inheritance (dominant or recessive) is known, the phenotypic ratios can be inferred as well. Each parent contributes one type of allele for a monohybrid cross of two true-breeding parents. In this case, only one genotype is possible.
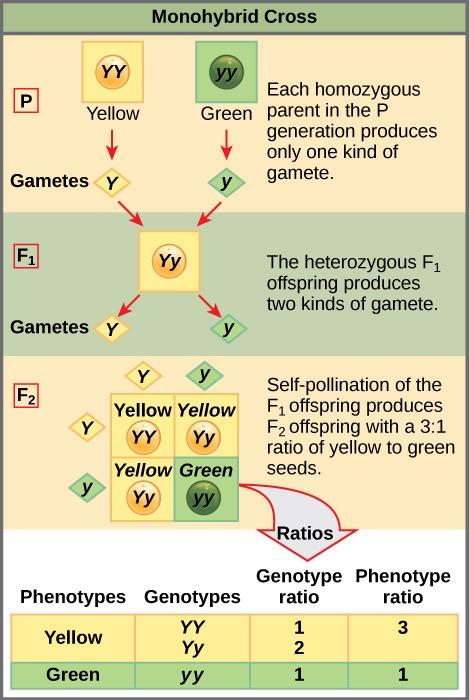
A self-cross of one of the Yy heterozygous offspring can be represented in a 2 × 2 Punnett square because each parent can donate one of two different alleles. Therefore, the offspring can potentially have one of four allele combinations: YY, Yy, yY, or yy (Fig 10.3). Notice that there are two ways to obtain the Yy genotype: a Y from the egg and a y from the sperm, or a y from the egg and a Y from the sperm. Both of these possibilities must be counted. Recall that Mendel’s pea-plant characteristics behaved in the same way in reciprocal crosses. Therefore, the two possible heterozygous combinations produce genotypically and phenotypically identical offspring despite their dominant and recessive alleles deriving from different parents. They are grouped together. Because fertilization is a random event, we expect each combination to be equally likely and for the offspring to exhibit a ratio of YY:Yy:yy genotypes of 1:2:1 (Figure 10.3). Furthermore, because the YY and Yy offspring have yellow seeds and are phenotypically identical, applying the sum rule of probability, we expect the offspring to exhibit a phenotypic ratio of 3 yellow:1 green. Indeed, working with large sample sizes, Mendel observed approximately this ratio in every F2 generation resulting from crosses for individual traits.
Mendel validated these results by performing an F3 cross in which he self-crossed the dominant- and recessive-expressing F2 plants. When he self-crossed the plants expressing green seeds, all of the offspring had green seeds, confirming that all green seeds had homozygous genotypes of yy. When he self-crossed the F2 plants expressing yellow seeds, he found that one-third of the plants bred true, and two-thirds of the plants segregated at a 3:1 ratio of yellow:green seeds. In this case, the true-breeding plants had homozygous (YY) genotypes, whereas the segregating plants corresponded to the heterozygous (Yy) genotype. When these plants were self-fertilized, the outcome was just like the F1 self-fertilizing cross.
Reading Question #3
What is the expected genotypic ratio in the F2 generation of a monohybrid cross between two true-breeding parents?
A. 1:2:1
B. 3:1
C. 1:1
D. 2:1
The Test Cross Distinguishes the Dominant Phenotype
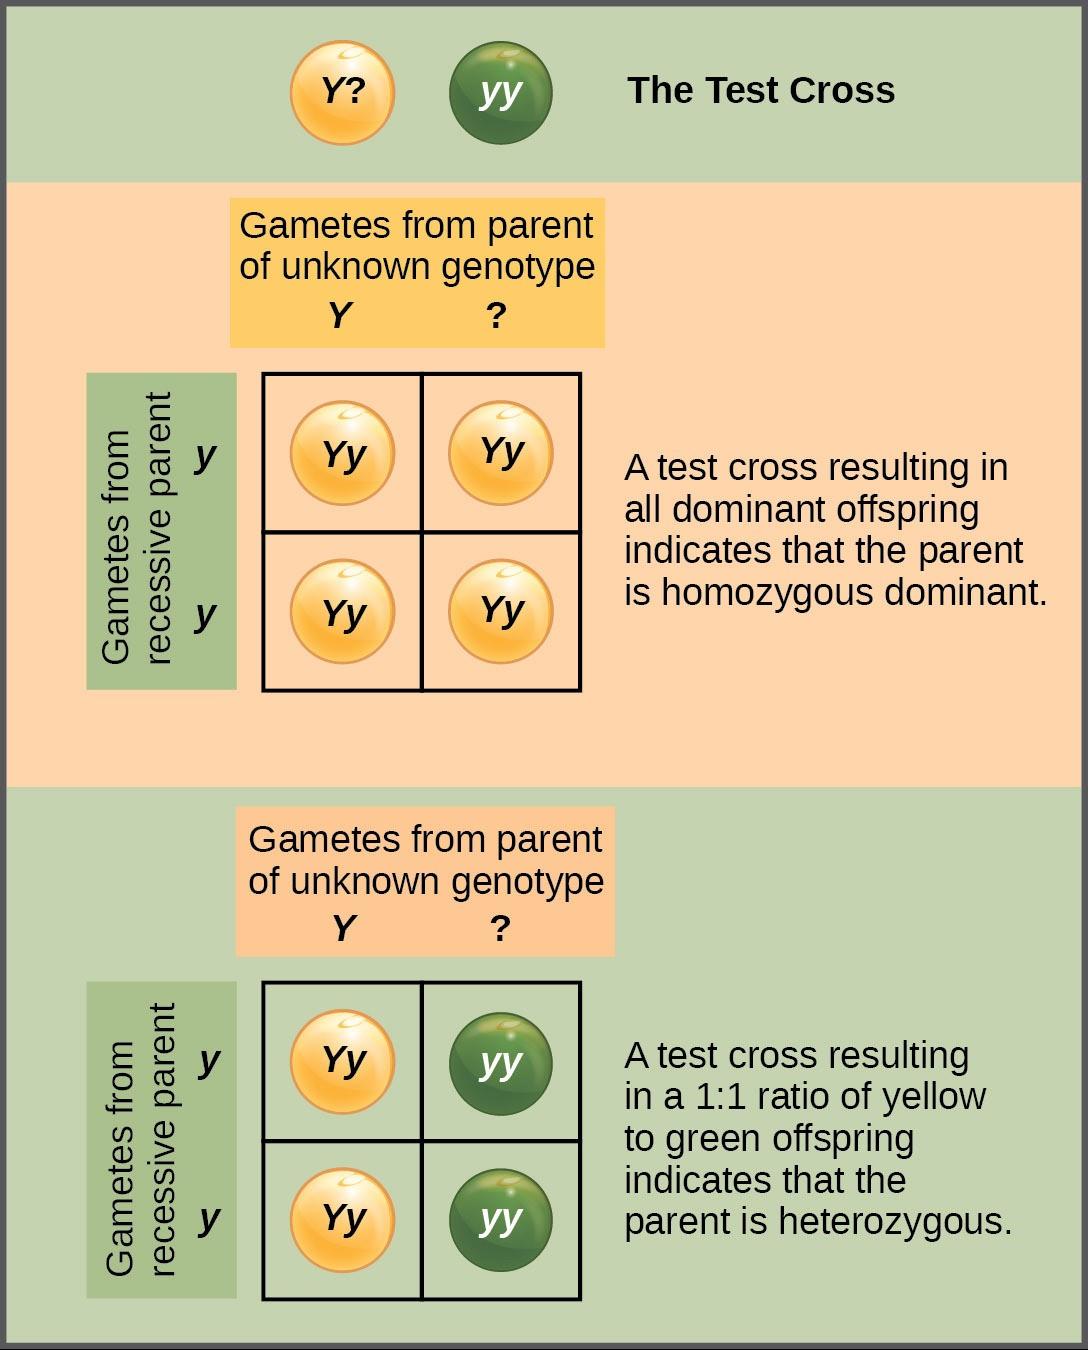
Beyond predicting the offspring of a cross between known homozygous or heterozygous parents, Mendel also developed a way to determine whether an organism that expressed a dominant trait was a heterozygote or a homozygote. Called the test cross, this technique is still used by plant and animal breeders. In a test cross, the dominant-expressing organism is crossed with a homozygous recessive organism for the same characteristic. If the dominant-expressing organism is a homozygote, then all F1 offspring will be heterozygotes expressing the dominant trait (Figure 10.4). Alternatively, if the dominant expressing organism is a heterozygote, the F1 offspring will exhibit a 1:1 ratio of heterozygotes and recessive homozygotes (Figure 10.4). The test cross further validates Mendel’s postulate that pairs of unit factors segregate equally.
The Punnett Square Approach for a Dihybrid Cross
Mendel’s law of independent assortment states that genes do not influence each other with regard to sorting alleles into gametes, and every possible combination of alleles for every gene is equally likely to occur. The independent assortment of genes can be illustrated by the dihybrid cross, a cross between two true-breeding parents that express different traits for two characteristics (di = two traits). Consider the characteristics of seed color and seed texture for two pea plants, one that has green, wrinkled seeds (yyrr) and another that has yellow, round seeds (YYRR). Because each parent is homozygous, the law of segregation indicates that the gametes for the green/wrinkled plant all are yr, and the gametes for the yellow/round plant are all YR. Therefore, the F1 generation of offspring all are YyRr (Figure 10.5).
For the F2 generation, the law of segregation requires that each gamete receive either an R allele or an r allele along with either a Y allele or a y allele. The law of independent assortment states that a gamete into which an r allele is sorted would be equally likely to contain either a Y allele or a y allele. Thus, there are four equally likely gametes that can be formed when the YyRr heterozygote is self-crossed, as follows: YR, Yr, yR, and yr. Arranging these gametes along the top and left of a 4 × 4 Punnett square (Figure 10.5) gives us 16 equally likely genotypic combinations. From these genotypes, we infer a phenotypic ratio of 9 round/yellow:3 round/green:3 wrinkled/yellow:1 wrinkled/green (Figure 10.5). These are the offspring ratios we would expect, assuming we performed the crosses with a large enough sample size.
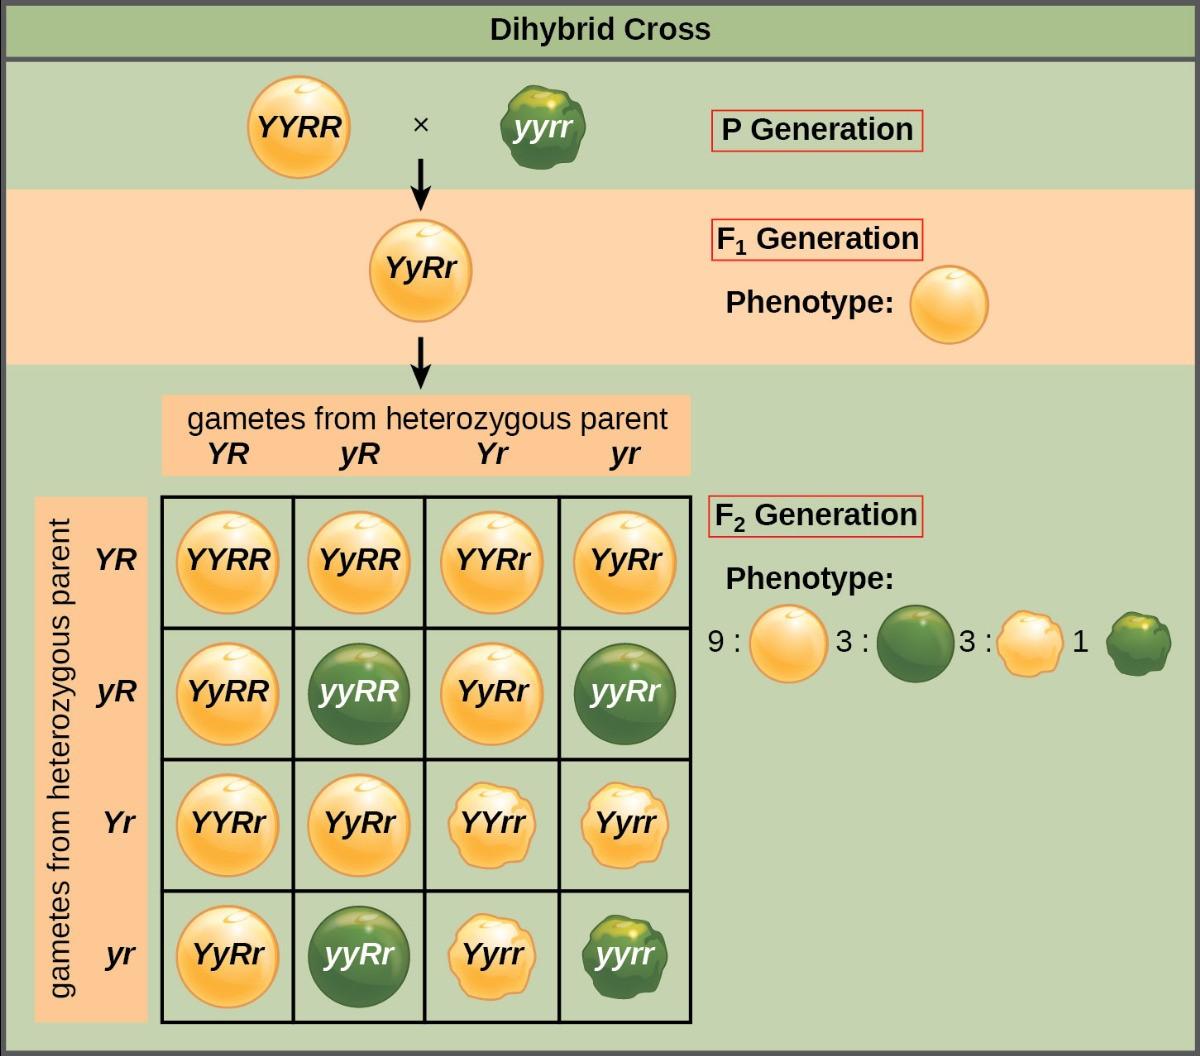
Because of independent assortment and dominance, the 9:3:3:1 dihybrid phenotypic ratio can be collapsed into two 3:1 ratios, characteristic of any monohybrid cross that follows a dominant and recessive pattern. Ignoring seed color and considering only seed texture in the above dihybrid cross, we would expect that three-quarters of the F2 generation offspring would be round, and one-quarter would be wrinkled. Similarly, isolating only seed color, we would assume that three-quarters of the F2 offspring would be yellow and one-quarter would be green. The sorting of alleles for texture and color are independent events, so we can apply the product rule. Therefore, the proportion of round and yellow F2 offspring is expected to be (3/4) × (3/4) = 9/16, and the proportion of wrinkled and green offspring is expected to be (1/4) × (1/4) = 1/16. These proportions are identical to those obtained using a Punnett square. Round, green and wrinkled, yellow offspring can also be calculated using the product rule, as each of these genotypes includes one dominant and one recessive phenotype. Therefore, the proportion of each is calculated as (3/4) × (1/ 4) = 3/16.
The law of independent assortment also indicates that a cross between yellow, wrinkled (YYrr) and green, round (yyRR) parents would yield the same F1 and F2 offspring as in the YYRR x yyrr cross.
The physical basis for the law of independent assortment also lies in meiosis I, in which the different homologous pairs line up in random orientations. Each gamete can contain any combination of paternal and maternal chromosomes (and therefore the genes on them) because the orientation of tetrads on the metaphase plane is random.
Research Connection: Testing the Hypothesis of Independent Assortment
To better appreciate the amount of labor and ingenuity that went into Mendel’s experiments, proceed through one of Mendel’s dihybrid crosses.
Question: What will be the offspring of a dihybrid cross?
Background: Consider that pea plants mature in one growing season, and you have access to a large garden in which you can cultivate thousands of pea plants. There are several true-breeding plants with the following pairs of traits: tall plants with inflated pods and short plants with constricted pods. Before the plants have matured, you remove the pollen-producing organs from the tall/inflated plants in your crosses to prevent self-fertilization. Upon plant maturation, the plants are manually crossed by transferring pollen from the short/constricted plants to the stigmata of the tall/inflated plants.
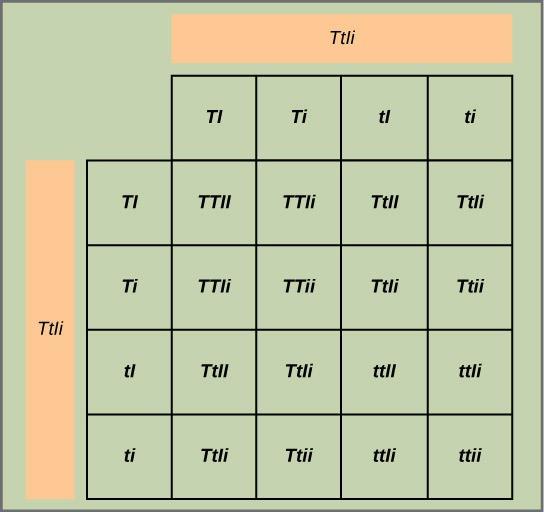
Hypothesis: Both trait pairs will sort independently according to Mendelian laws. When the true-breeding parents are crossed, all of the F1 offspring are tall and have inflated pods, indicating that the tall and inflated traits dominate over the short and constricted traits, respectively. A self-cross of the F1 heterozygotes results in 2,000 F2 progeny.
Because each trait pair sorts independently, the ratios of tall:short and inflated:constricted are each expected to be 3:1. The tall/short trait pair is called T/t, and the inflated/constricted trait pair is designated I/i. Each member of the F1 generation therefore has a genotype of TtIi.
You predict that you will observe the following offspring proportions:
tall/inflated:tall/constricted:short/inflated:short/constricted in a 9:3:3:1 ratio
Test the hypothesis: Theoretical: Construct a grid analogous to Figure 10.6, in which you cross two TtIi individuals. Each individual can donate four combinations of two traits: TI, Ti, tI, or ti, meaning that there are 16 possibilities of offspring genotypes. Because the T and I alleles are dominant, any individual having one or two of those alleles will express the tall or inflated phenotypes, respectively, regardless if they also have a t or i allele. Only individuals that are tt or ii will express the short and constricted alleles, respectively. Notice that when you consider the tall/short and inflated/constricted trait pairs in isolation, they are each inherited in 3:1 ratios.
Test the Hypothesis: Experimental: You cross the short and tall plants and then self-cross the offspring. For best results, this is repeated with hundreds or even thousands of pea plants. What special precautions should be taken during the crosses and in growing the plants?
Analyze your data: You observe the following plant phenotypes in the F2 generation: 2706 tall/inflated, 930 tall/constricted, 888 short/inflated, and 300 short/constricted. Reduce these findings to a ratio and determine if they are consistent with Mendelian laws.
Form a conclusion: Were the results close to the expected 9:3:3:1 phenotypic ratio? Do the results support the prediction? What might be observed if far fewer plants were used, given that alleles segregate randomly into gametes? Try to imagine growing that many pea plants and consider the potential for experimental error. For instance, what would happen if it was extremely windy one day?
Reading Question #4
If a dihybrid cross involves two characteristics, each with a dominant and recessive trait, and the probability of having the dominant trait for each characteristic is 3/4, what is the probability of having both dominant traits in the F2 generation?
A. 9/16
B. 1/4
C. 3/8
D. 1/2
Reading Question #5
In a dihybrid cross between pea plants that are heterozygous for the tall/dwarf and inflated/constricted alleles (TtIi), how many possible combinations of offspring genotypes are there?
A. 4
B. 8
C. 12
D. 16
Acknowledgements
Adapted from Clark, M.A., Douglas, M., and Choi, J. (2018). Biology 2e. OpenStax. Retrieved from https://openstax.org/books/biology-2e/pages/1-introduction
Adapted from Boundless. (2023). General Biology. LibreTexts. Retrieved from https://bio.libretexts.org/Bookshelves/Introductory_and_General_Biology/Book%3A_General_Biology_(Boundless).
