
12 Chapter 12: Life Histories
Anastasia Chouvalova and Lisa Limeri
Learning Objectives
By the end of this section, students will be able to…
- Define and apply terms that describe species life histories: semelparity, iteroparity, life history curves.
- Discuss the ecological and evolutionary trade-offs associated with different life history strategies.
Life History Patterns and Energy Budgets
Energy is required by all living organisms for their growth, maintenance, and reproduction; at the same time, energy is often a major limiting factor in determining an organism’s survival. Plants, for example, acquire energy from the sun via photosynthesis, but must expend this energy to grow, maintain health, and produce energy-rich seeds to produce the next generation. Animals have the additional burden of using some of their energy reserves to acquire food. Furthermore, some animals must expend energy caring for their offspring. Thus, all species have an energy budget: they must balance energy intake with their use of energy for metabolism, reproduction, parental care, and energy storage (such as bears building up body fat for winter hibernation).
Parental Care and Fecundity
Fecundity is the potential reproductive capacity of an individual within a population. In other words, fecundity describes how many offspring could ideally be produced if an individual has as many offspring as possible, repeating the reproductive cycle as soon as possible after the birth of the offspring. In animals, fecundity is inversely related to the amount of parental care given to an individual offspring. Species, such as many marine invertebrates, that produce many offspring usually provide little if any care for the offspring (they would not have the energy or the ability to do so anyway). Most of their energy budget is used to produce many tiny offspring. Animals with this strategy are often self-sufficient at a very early age. This is because of the energy tradeoff these organisms have made to maximize their evolutionary fitness. Because their energy is used for producing offspring instead of parental care, it makes sense that these offspring have some ability to be able to move within their environment and find food and perhaps shelter. Even with these abilities, their small size makes them extremely vulnerable to predation, so the production of many offspring allows enough of them to survive to maintain the species.
Animal species that have few offspring during a reproductive event usually give extensive parental care, devoting much of their energy budget to these activities, sometimes at the expense of their own health. This is the case with many mammals, such as humans, kangaroos, and pandas. The offspring of these species are relatively helpless at birth and need to develop before they achieve self-sufficiency.
Plants with low fecundity produce few energy-rich seeds (such as coconuts and chestnuts) with each having a good chance to germinate into a new organism; plants with high fecundity usually have many small, energy-poor seeds (like orchids) that have a relatively poor chance of surviving. Although it may seem that coconuts and chestnuts have a better chance of surviving, the energy tradeoff of the orchid is also very effective. It is a matter of where the energy is used, for large numbers of seeds or for fewer seeds with more energy.
Early versus Late Reproduction
The timing of reproduction in a life history also affects species survival. Organisms that reproduce at an early age have a greater chance of producing offspring, but this is usually at the expense of their growth and the maintenance of their health. Conversely, organisms that start reproducing later in life often have greater fecundity or are better able to provide parental care, but they risk that they will not survive to reproductive age. Examples of this can be seen in fishes. Small fish, like guppies, use their energy to reproduce rapidly, but never attain the size that would give them defense against some predators. Larger fish, like the bluegill or shark, use their energy to attain a large size, but do so with the risk that they will die before they can reproduce or at least reproduce to their maximum. These different energy strategies and tradeoffs are key to understanding the evolution of each species as it maximizes its fitness and fills its niche. In terms of energy budgeting, some species “blow it all” and use up most of their energy reserves to reproduce early before they die. Other species delay having reproduction to become stronger, more experienced individuals and to make sure that they are strong enough to provide parental care if necessary.
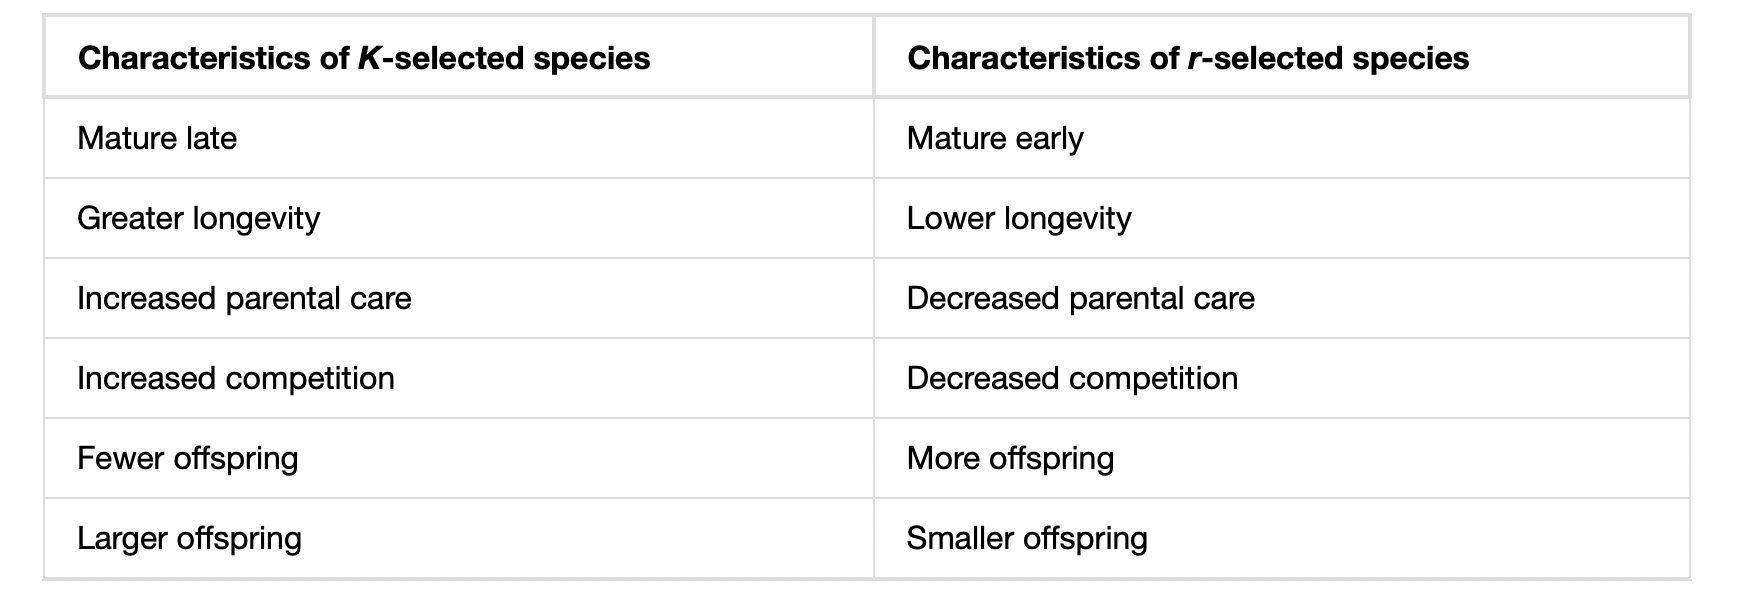
K-selected and r-selected species
Some life history traits, such as fecundity, timing of reproduction, and parental care, can be grouped together into general strategies that are used by multiple species. Ecologists describe some of these strategies as r-selection and K-selection.
The regulation of population growth by resource limitation and reproductive potential can be used to introduce a classical concept in population biology: that of K-selected versus r-selected species. By the second half of the twentieth century, the concept of K- and r-selected species was used extensively and successfully to study populations. The concept relates not only to reproductive strategies, but also to a species’ habitat and behavior. This includes the way they obtain resources and care for their young, as well as length of life and survivorship factors. For this analysis, population biologists have grouped species into the two large categories, K-selected and r-selected, although they are really two ends of a continuum. The first variable is K (the carrying capacity of a population; density dependent), and the second variable is r (the intrinsic rate of natural increase in population size, density independent).
K-selected species
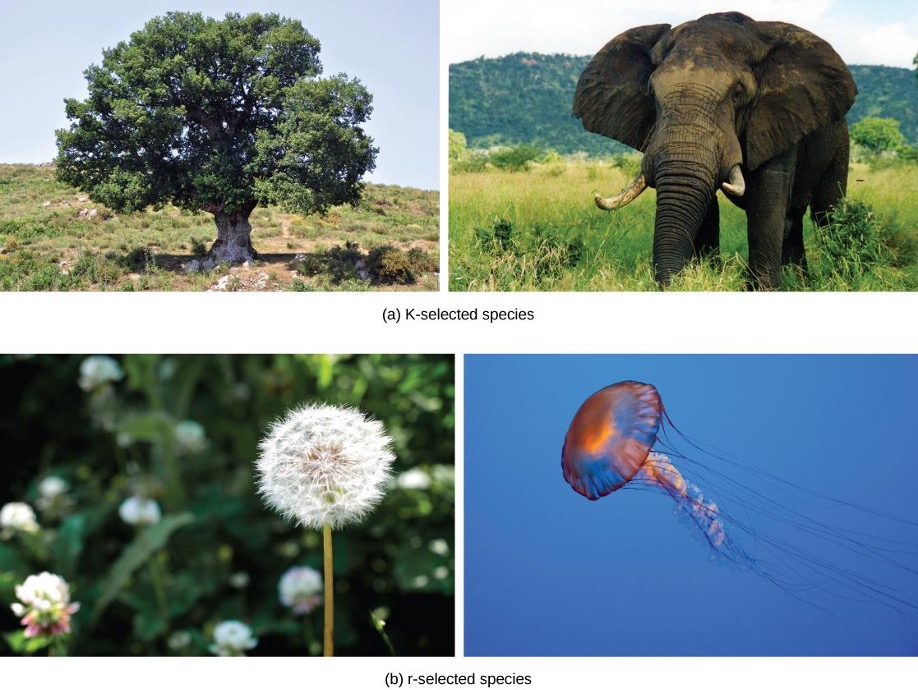
K-selected species are species selected by stable, predictable environments. Populations of K-selected species tend to exist close to their carrying capacity (hence the term K-selected) where intraspecific competition is high. These species tend to have few, large offspring, a long gestation period, and often give long-term care to their offspring (see Table 12.1 for a comparison of K vs. r-selected species ). While larger in size when born, the offspring are relatively helpless and immature at birth. By the time they reach adulthood, they must develop skills to compete for natural resources. In plants, scientists think of parental care more broadly: how long fruit takes to develop or how long it remains on the plant are determining factors in the time to the next reproductive event. Examples of K-selected species are primates (including humans), elephants, and plants such as oak trees (Figure 12.1).
Oak trees grow very slowly and take, on average, 20 years to produce their first seeds, known as acorns. As oak trees grow to a large size and for many years before they begin to produce acorns, they devote a large percentage of their energy budget to growth and maintenance. The tree’s height and size allow it to dominate other plants in the competition for sunlight, the oak’s primary energy resource. Furthermore, when it does reproduce, the oak produces large, energy-rich seeds that use their energy reserve to become quickly established (K-selection).
In summary, K-selected species tend to have few offspring, inhabit stable and unfluctuating environments, have longer gestation periods, provide their offspring with long-term care after they are born.
Reading Question #1
Which of the following traits of bison indicates that they are a K-selected species?
A. Bison are relatively large (30-70 pounds) when they are born.
B. Bison graze on grass
C. Bison have thick fur to protect from cold weather
D. Male bison physically compete with each other for mates.
r-selected species
In contrast, r-selected species tend to have a large number of small offspring (hence their r designation; Table 12.1). This strategy is often employed in unpredictable or changing environments. Animals that are r-selected tend to not give long-term parental care and the offspring are relatively mature and self-sufficient at birth. Examples of r-selected species are marine invertebrates, such as jellyfish, and plants, such as the dandelion (Figure 12.1b). Dandelions have small seeds that are wind dispersed long distances. Many seeds are produced simultaneously to ensure that at least some of them reach a hospitable environment. Seeds that land in inhospitable environments have little chance for survival since their seeds are low in energy content. Note that survival is not necessarily a function of energy stored in the seed itself.
In summary, r-selected species tend to have many offspring, inhabit unstable and fluctuating environments, have shorter gestation periods, do not provide their offspring with long-term care after they are born.
Reading Question #2
Which of the following species is most likely to be an r-selected species?
A. A species in which the individuals reach sexual maturity relatively late in life.
B. A species that experiences intense intraspecific competition.
C. A species that produces a large number of offspring at one time.
D. A species that provides a lot of parental care to their offspring.
By the second half of the twentieth century, the concept of K- and r-selected species was used extensively and successfully to study populations. The r- and K-selection theory, although accepted for decades and used for much groundbreaking research, has now been reconsidered, and many population biologists have abandoned or modified it. One reason is that there are many species that do not fully conform to the predictions and r- and K-selection. For example, although oak trees live a long time and invest lots of energy into growth and maintenance (K-selected traits), they also produce huge numbers of offspring (thousands of acorns) which they invest minimally in each offspring and provide no care (r-selected traits).
Furthermore, r- vs. K-selection theory ignored the age-specific mortality of the populations which scientists now know is very important. New demographic-based models of life history evolution have been developed which incorporate many ecological concepts included in r- and K-selection theory as well as population age structure and mortality factors.
Reproductive Strategy
One important trait describing a species’ life history is their reproductive strategy: semelparity or iteroparity.
Semelparity occurs when a species reproduces only once during its lifetime and then dies. Such species use most of their resource budget during a single reproductive event, sacrificing their health to the point that they do not survive. Examples of semelparity are bamboo, which flowers once and then dies, and the Chinook salmon (Figure 12.2a), which uses most of its energy reserves to migrate from the ocean to its freshwater nesting area, where it reproduces and then dies. Scientists have posited alternate explanations for the evolutionary advantage of the Chinook’s post-reproduction death: a programmed suicide caused by a massive release of corticosteroid hormones, presumably so the parents can become food for the offspring, or simple exhaustion caused by the energy demands of reproduction; these are still being debated. Semelparity is consistent with r-selected strategies as many offspring are produced and there is low parental input, as one or both parents die after mating.
Iteroparity describes species that reproduce repeatedly during their lives. Some animals are able to mate only once per year, but survive multiple mating seasons. The pronghorn antelope is an example of an animal that goes into a seasonal estrus cycle (“heat”): a hormonally induced physiological condition preparing the body for successful mating (Fig 12.2b). Females of these species mate only during the estrus phase of the cycle. A different pattern is observed in primates, including humans and chimpanzees, which may attempt reproduction at any time during their reproductive years, even though their menstrual cycles make pregnancy likely only a few days per month during ovulation (Fig 12.2c). Iteroparity is consistent with K-selected strategies as individuals invest in their own growth and maintenance so that they can survive many reproductive events and care for their young after birth.
Reading Question #3
What is the primary difference between iteroparity and semelparity?
A. The number of offspring produced.
B. The number of times an individual reproduces during its lifetime.
C. The amount of parental care provided to offspring.
D. The amount of resources invested in reproduction.
Survivorship Curves
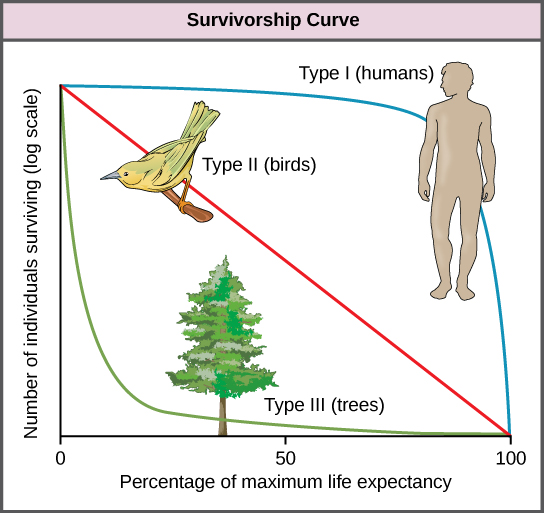
Population ecologists describe mortality rates across organisms’ life spans using survivorship curves. A survivorship curve is a graph of the number of individuals surviving at each age interval plotted versus time (usually with data compiled from a life table). These curves allow us to compare the life histories of different populations (Figure 12.3). There are 3 types of Survivorship curves which are distinguished by the ages at which mortality is highest in the population. Humans and most primates exhibit a Type I survivorship curve because a high percentage of offspring survive their early and middle years—death occurs predominantly in older individuals. These types of species usually have small numbers of offspring at one time, and they give a high amount of parental care to them to ensure their survival. Birds are an example of an intermediate or Type II survivorship curve because birds die more or less equally at each age interval. These organisms also may have relatively few offspring and provide significant parental care. Trees, marine invertebrates, and most fishes exhibit a Type III survivorship curve because very few of these organisms survive their younger years; however, those that make it to an old age are more likely to survive for a relatively long period of time. Organisms in this category usually have a very large number of offspring, but once they are born, little parental care is provided. Thus these offspring are “on their own” and vulnerable to predation, but their sheer numbers assure the survival of enough individuals to perpetuate the species.
Reading Question #4
A turtle is equally likely to die at 10 years and at 100 years. Which type of survivorship curve are they most likely to exhibit, based on this statement?
A. Type I
B. Type II
C. Type III
D. Type IV
Reading Question #5
Female orange sulfur butterflies lay thousands of eggs, the vast majority of which die due to disease, competition, or predation. What survivorship curve best describes orange sulfur butterflies?
A. Type I
B. Type II
C. Type III
D. Not enough information to tell
References
Adapted from
Clark, M.A., Douglas, M., and Choi, J. (2018). Biology 2e. OpenStax. Retrieved from https://openstax.org/books/biology-2e/pages/45-4-population-dynamics-and-regulation?query=K-selected%20species&target=%7B%22type%22%3A%22search%22%2C%22index%22%3A0%7D#fs-idm133176480
and
Various authors (2022). General Biology (Boundless). LibreTexts. Retrieved from https://bio.libretexts.org/Bookshelves/Introductory_and_General_Biology/Book%3A_General_Biology_(Boundless)/45%3A_Population_and_Community_Ecology/45.03%3A_Life_History_Patterns/45.3B%3A_Theories_of_Life_History
