
16 Chapter 16: Trophic Interactions
Anastasia Chouvalova and Lisa Limeri
Learning Objectives
By the end of this section, students will be able to…
- Categorize organisms into the appropriate trophic level [producers, primary consumers, secondary consumers, tertiary (apex) consumers] in a four-tier food chain.
- Model the generalized flow of energy through an ecosystem, including the primary inflow of energy into the system, major transformations of energy throughout the system, and pathways of energy loss from the system.
- Predict potential direct or indirect impacts of modifications to components of a food chain or web on the other system components including the importance of keystone species.
Food Chains
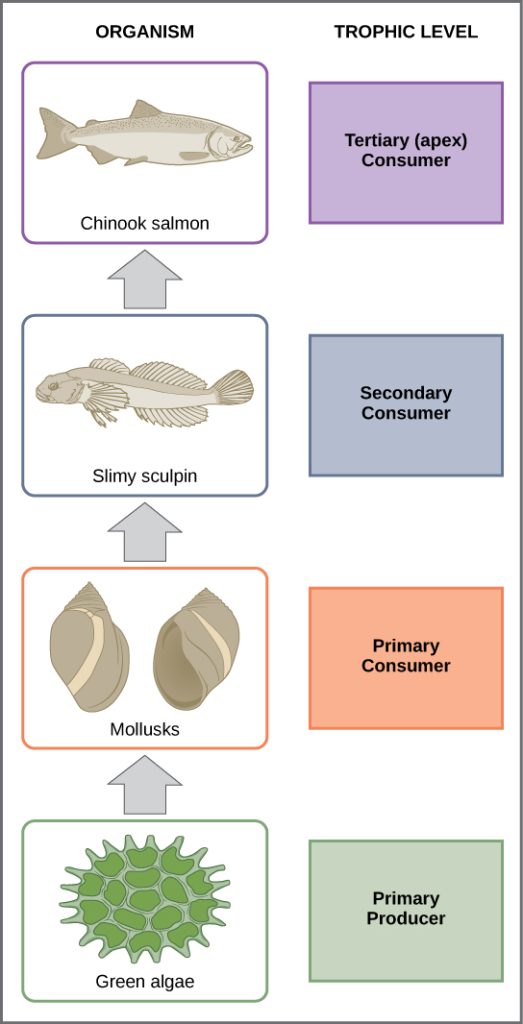
A food chain is a linear sequence of organisms through which nutrients and energy pass: primary producers, primary consumers, and higher-level consumers are used to describe ecosystem structure and dynamics. There is a single path through the chain. Each organism in a food chain occupies what is called a trophic level. Depending on their role as producers or consumers, species or groups of species can be assigned to various trophic levels.
In most ecosystems, the bottom of the food chain consists of photosynthetic organisms (plants and/or phytoplankton), which are called primary producers. The organisms that consume the primary producers are herbivores: the primary consumers. Secondary consumers are usually carnivores that eat the primary consumers. Tertiary consumers are carnivores that eat other carnivores. Higher-level consumers feed on the next lower trophic levels, and so on, up to the organisms at the top of the food chain: the apex consumers. In the Lake Ontario food chain shown in Figure 16.1, the Chinook salmon is the apex consumer at the top of this food chain.
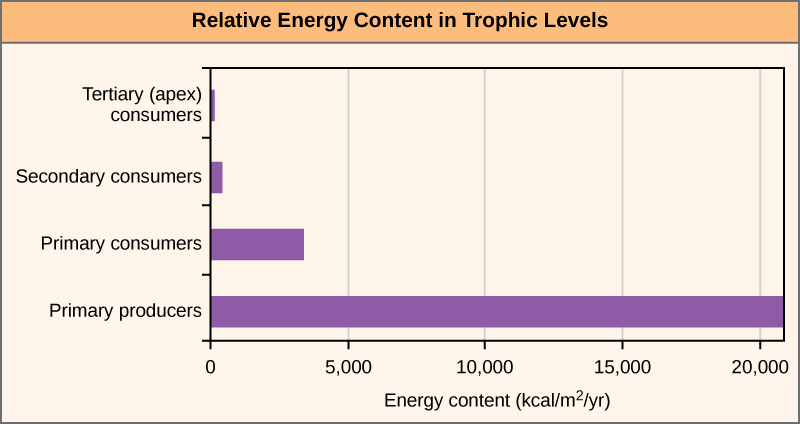
One major factor that limits the length of food chains is energy. Energy is lost as heat between each trophic level due to the second law of thermodynamics. Thus, after a limited number of trophic energy transfers, the amount of energy remaining in the food chain may not be great enough to support viable populations at yet a higher trophic level.
The loss of energy between trophic levels is illustrated by the pioneering studies of Howard T. Odum in the Silver Springs, Florida, ecosystem in the 1940s (Fig 16.2). The primary producers generated 20,819 kcal/m2/yr (kilocalories per square meter per year), the primary consumers generated 3368 kcal/m2/yr, the secondary consumers generated 383 kcal/m2/yr, and the tertiary consumers only generated 21 kcal/m2/yr. Thus, there is little energy remaining for another level of consumers in this ecosystem.
Food Webs
Food chains are a simplified model that do not accurately describe most ecosystems. Even when all organisms are grouped into appropriate trophic levels, some of these organisms can feed on species from more than one trophic level; likewise, some of these organisms can be eaten by species from multiple trophic levels. In other words, the linear model of ecosystems, the food chain, is not completely descriptive of ecosystem structure. A holistic model—which accounts for all the interactions between different species and their complex interconnected relationships with each other and with the environment—is a more accurate and descriptive model for ecosystems.
A food web is a model of a holistic, nonlinear web of primary producers, primary consumers, and higher-level consumers used to describe ecosystem structure and dynamics (Fig 16.3). A food web accounts for the multiple trophic (feeding) interactions between each species and the many species it may feed on, or that feed on it. In a food web, the several trophic connections between each species and the other species that interact with it may cross multiple trophic levels. The matter and energy movements of virtually all ecosystems are more accurately described by food webs.
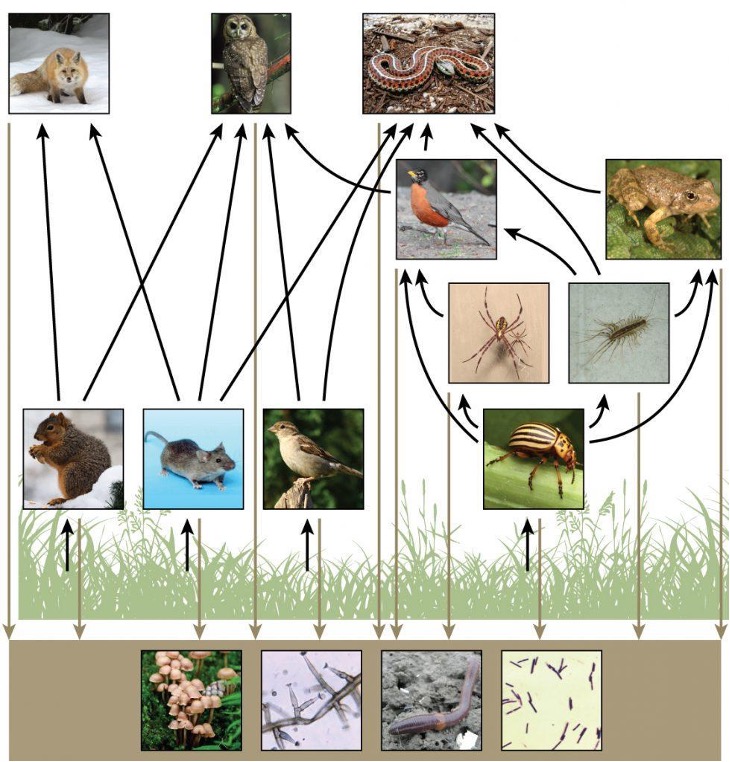
Two general types of food webs are often shown interacting within a single ecosystem. A grazing food web has plants or other photosynthetic organisms at its base, followed by herbivores and various carnivores. A detrital food web consists of a base of organisms that feed on decaying organic matter (dead organisms), including decomposers (which break down dead and decaying organisms) and detritivores (which consume organic detritus), as depicted in Figure 16.3. These organisms are usually bacteria or fungi that recycle organic material back into the biotic part of the ecosystem as they themselves are consumed by other organisms. As all ecosystems require a method to recycle material from dead organisms, most grazing food webs have an associated detrital food web. For example, in a meadow ecosystem, plants may support a grazing food web of different organisms, primary and other levels of consumers, while at the same time supporting a detrital food web of bacteria and fungi feeding off dead plants and animals. Simultaneously, a detrital food web can contribute energy to a grazing food web, as when a robin eats an earthworm (e.g., Fig 16.3).
Reading Question #1
In a grazing oceanic food web, who would likely be the primary producer?
A. Fungi
B. Protist
C. Krill
D. Phytoplankton
How Organisms Acquire Energy
All living things require energy in one form or another. It is important to understand how organisms acquire energy and how that energy is passed from one organism to another through food webs and their constituent food chains. Food webs illustrate how energy flows directionally through ecosystems, including how efficiently organisms acquire it, use it, and how much remains for use by other organisms of the food web.
Energy is acquired by living things in three ways: photosynthesis, chemosynthesis, and the consumption and digestion of other living or previously living organisms by heterotrophs.
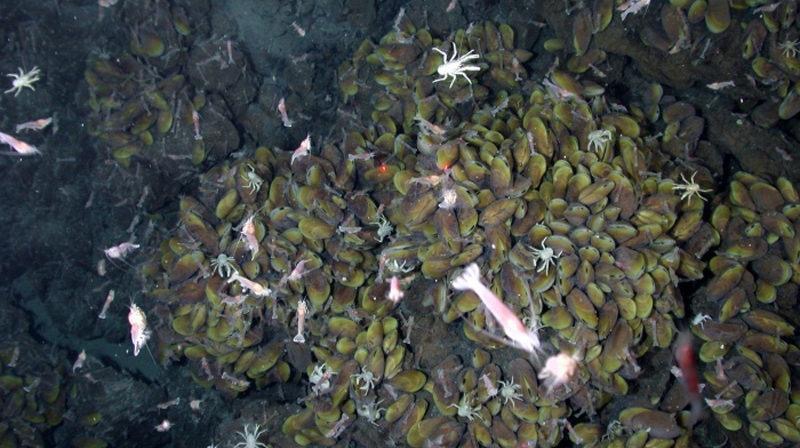
Photosynthetic and chemosynthetic organisms are both grouped into a category known as autotrophs: organisms capable of synthesizing their own food (more specifically, capable of using inorganic carbon as a carbon source). Photosynthetic autotrophs (photoautotrophs) use sunlight as an energy source, whereas chemosynthetic autotrophs (chemoautotrophs) use inorganic molecules as an energy source (Fig 16.4). Autotrophs are critical for all ecosystems. Without these organisms, energy would not be available to other living organisms and life itself would not be possible.
Photoautotrophs, such as plants, algae, and photosynthetic bacteria, serve as the energy source for a majority of the world’s ecosystems. The rate at which photosynthetic producers harness energy from the Sun is called gross primary productivity. However, not all of the energy incorporated by producers is available to the other organisms in the food web because producers must also grow and reproduce, which consumes energy, and some is lost as heat due to the second law of thermodynamics. Net primary productivity is the energy that remains in the producers after accounting for these organisms’ respiration and heat loss. The net productivity is then available to the primary consumers at the next trophic level.
Chemoautotrophs are primarily bacteria that are found in rare ecosystems where sunlight is not available, such as in those associated with dark caves or hydrothermal vents at the bottom of the ocean (Fig 16.4). Many chemoautotrophs in hydrothermal vents use hydrogen sulfide (H2S), which is released from the vents, as a source of chemical energy. This allows chemoautotrophs to synthesize complex organic molecules, such as glucose, for their own energy and in turn supplies energy to the rest of the ecosystem.
Reading Question #2
Which statement accurately contrasts heterotrophs from autotrophs?
A. Heterotrophs can photosynthesize, while autotrophs cannot.
B. Heterotrophs cannot photosynthesize, while autotrophs can.
C. Heterotrophs cannot obtain their own food, while autotrophs can.
D. Both A and C
E. Both B and C
Bioaccumulation
One of the most important environmental consequences of ecosystem dynamics is bioaccumulation.. Bioaccumulation is the increasing concentration of persistent, toxic substances in organisms at each trophic level, from the primary producers to the apex consumers. These are substances that are fat soluble, not water soluble, and are stored in the fat reserves of each organism. Many substances have been shown to bioaccumulate, including classical studies with the pesticide dichlorodiphenyltrichloroethane (DDT), which was published in the 1960s bestseller, Silent Spring, by Rachel Carson. DDT was a commonly-used pesticide before its dangers became known. In some aquatic ecosystems, organisms from each trophic level consumed many organisms of the lower level, which caused DDT to increase in birds (apex consumers) that ate fish. Thus, the birds accumulated sufficient amounts of DDT to cause fragility in their eggshells. This effect increased egg breakage during nesting and was shown to have adverse effects on these bird populations. The use of DDT was banned in the United States in the 1970s.
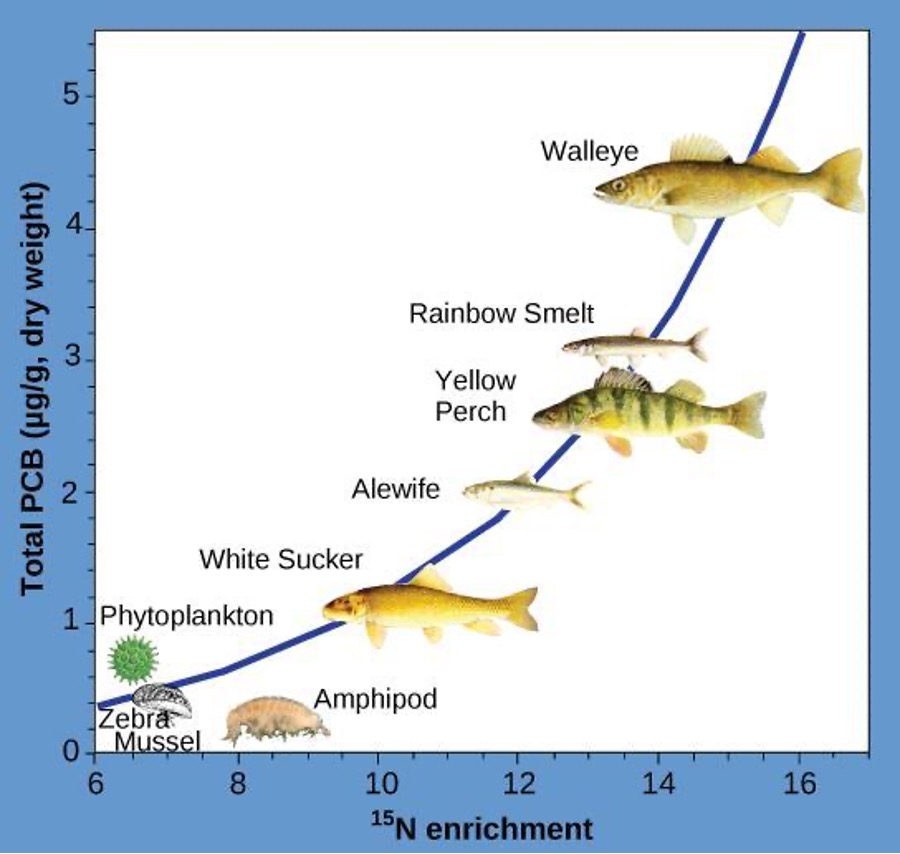
Other substances that bioaccumulate are polychlorinated biphenyls (PCBs), which were used in coolant liquids in the United States until their use was banned in 1979, and heavy metals, such as mercury, lead, and cadmium. These substances were best studied in aquatic ecosystems, where fish species at different trophic levels accumulate toxic substances brought through the ecosystem by the primary producers. As illustrated in a study performed by the National Oceanic and Atmospheric Administration (NOAA) in the Saginaw Bay of Lake Huron, PCB concentrations increased from the ecosystem’s primary producers (phytoplankton) through the different trophic levels of fish species (Figure 16.5). The apex consumer (walleye) has more than four times the amount of PCBs compared to phytoplankton. Also, based on results from other studies, birds that eat these fish may have PCB levels at least one order of magnitude higher than those found in the lake fish.
Other concerns have been raised by the accumulation of heavy metals, such as mercury and cadmium, in certain types of seafood. The United States Environmental Protection Agency (EPA) recommends that pregnant women and young children should not consume any swordfish, shark, king mackerel, or tilefish because of their high mercury content. These individuals are advised to eat fish low in mercury: salmon, tilapia, shrimp, pollock, and catfish. Bioaccumulation is a good example of how ecosystem dynamics can affect our everyday lives, even influencing the food we eat.
Productivity within Trophic Levels
Productivity within an ecosystem can be defined as the percentage of energy entering the ecosystem that becomes incorporated into biomass in a particular trophic level. Biomass is the total mass, in a unit area at the time of measurement, of living or previously living organisms within a trophic level. Ecosystems have characteristic amounts of biomass at each trophic level. For example, in the English Channel ecosystem the primary producers account for a biomass of 4 g/m2 (grams per meter squared), while the primary consumers exhibit a biomass of 21 g/m2.
The productivity of the primary producers is especially important in any ecosystem because these organisms bring energy to other living organisms by photoautotrophy or chemoautotrophy. The rate at which photosynthetic primary producers incorporate energy from the sun is called gross primary productivity. An example of gross primary productivity is shown in the compartment diagram of energy flow in Howard T. Odum’s classical study of the Silver Springs, Florida, holistic ecosystem in the mid-twentieth century (Fig 16.6). This study shows the energy content and transfer between various ecosystem compartments. In this ecosystem, the total energy accumulated by the primary producers (gross primary productivity) was shown to be 20,810 kcal/m2/yr.
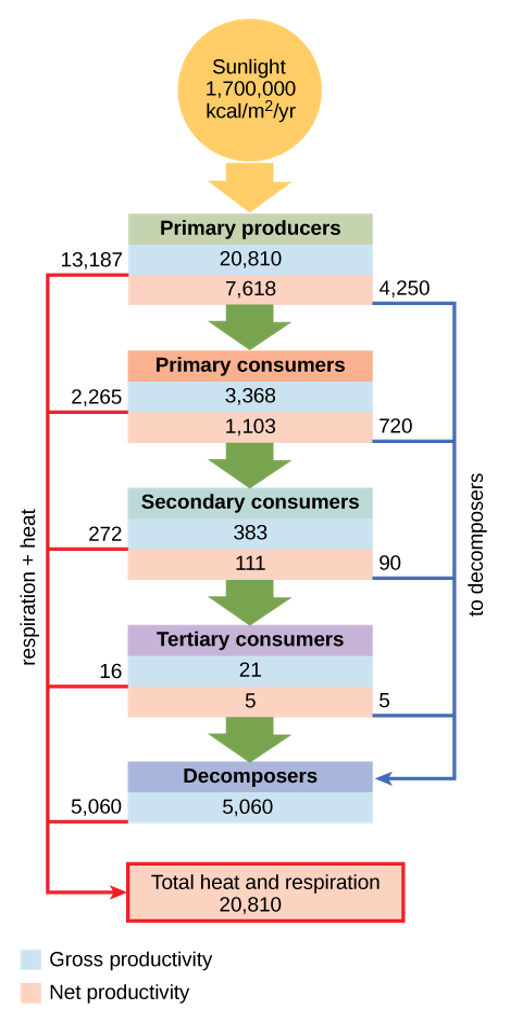
Because all organisms need to use some of this energy for their own functions (like respiration and resulting metabolic heat loss) scientists often refer to the net primary productivity of an ecosystem. Net primary productivity is the energy that remains in the primary producers after accounting for the organisms’ respiration and heat loss. The net productivity is then available to the primary consumers at the next trophic level. In our Silver Spring example, 13,187 of the 20,810 kcal/m2/yr were used for respiration or were lost as heat, leaving 7,632 kcal/m2/yr of energy for use by the primary consumers.
Reading Question #3
What happens to the amount of energy available as trophic level increases? At higher trophic levels, the amount of energy…
A. Increases
B. Decreases
C. Does not change
Ecological Efficiency
As illustrated in Figure 16.6, large amounts of energy are lost from the ecosystem from one trophic level to the next level as energy flows from the primary producers through the various trophic levels of consumers and decomposers. The main reason for this loss is the second law of thermodynamics, which states that whenever energy is converted from one form to another, there is a tendency toward disorder (entropy) in the system. In biologic systems, this means a great deal of energy is lost as metabolic heat when the organisms from one trophic level consume the next level. In the Silver Springs ecosystem example (Figure 16.6), we see that the primary consumers produced 1103 kcal/m2/yr from the 7618 kcal/m2/yr of energy available to them from the primary producers. The measurement of energy transfer efficiency between two successive trophic levels is termed the trophic level transfer efficiency (TLTE) and is defined by the formula:

In Silver Springs, the TLTE between the first two trophic levels was approximately 14.8%. The low efficiency of energy transfer between trophic levels is usually the major factor that limits the length of food chains observed in a food web. The fact is, after four to six energy transfers, there is not enough energy left to support another trophic level.
Ecologists have many different methods of measuring energy transfers within ecosystems. Some transfers are easier or more difficult to measure depending on the complexity of the ecosystem and how much access scientists have to observe the ecosystem. In other words, some ecosystems are more difficult to study than others, and sometimes the quantification of energy transfers has to be estimated.
Another main parameter that is important in characterizing energy flow within an ecosystem is the net production efficiency. Net production efficiency (NPE) allows ecologists to quantify how efficiently organisms of a particular trophic level incorporate the energy they receive into biomass; it is calculated using the following formula:

Net consumer productivity is the energy content available to the organisms of the next trophic level. Assimilation is the biomass (energy content generated per unit area) of the present trophic level after accounting for the energy lost due to incomplete ingestion of food, energy used for respiration, and energy lost as waste. Incomplete ingestion refers to the fact that some consumers eat only a part of their food. For example, when a lion kills an antelope, it will eat everything except the hide and bones. The lion is missing the energy-rich bone marrow inside the bone, so the lion does not make use of all the calories its prey could provide.
Thus, NPE measures how efficiently each trophic level uses and incorporates the energy from its food into biomass to fuel the next trophic level. In general, cold-blooded animals (ectotherms), such as invertebrates, fish, amphibians, and reptiles, use less of the energy they obtain for respiration and heat than warm-blooded animals (endotherms), such as birds and mammals. The extra heat generated in endotherms, although an advantage in terms of the activity of these organisms in colder environments, is a major disadvantage in terms of NPE. Therefore, many endotherms have to eat more often than ectotherms to get the energy they need for survival. In general, NPE for ectotherms is an order of magnitude (10x) higher than for endotherms. For example, the NPE for a caterpillar eating leaves has been measured at 18%, whereas the NPE for a squirrel eating acorns may be as low as 1.6%.
The inefficiency of energy use by warm-blooded animals has broad implications for the world’s food supply. It is widely accepted that the meat industry uses large amounts of crops to feed livestock, and because the NPE is low, much of the energy from animal feed is lost. For example, it costs about 1¢ to produce 1000 dietary calories (kcal) of corn or soybeans, but approximately $0.19 to produce a similar number of calories growing cattle for beef consumption. The same energy content of milk from cattle is also costly, at approximately $0.16 per 1000 kcal. Much of this difference is due to the low NPE of cattle. Thus, there has been a growing movement worldwide to promote the consumption of non-meat and non-dairy foods so that less energy is wasted feeding animals for the meat industry.
Reading Question #4
Why is trophic level transfer efficiency less than 100%?
A. Heat loss
B. Imperfect ingestion
C. Cellular respiration
D. All of the above
Ecological Pyramids
The structure of ecosystems can be visualized with ecological pyramids, which were first described by the pioneering studies of Charles Elton in the 1920s. Ecological pyramids show the relative amounts of various parameters (such as number of organisms, energy, and biomass) across trophic levels (Fig 16.7).
Pyramids of numbers can be either upright or inverted, depending on the ecosystem. As shown in Figure 16.7b, a typical grassland during the summer has a base of many plants and the numbers of organisms decrease at each trophic level. However, during the summer in a temperate forest, the base of the pyramid consists of few trees compared with the number of primary consumers, mostly insects. Because trees are large, they have great photosynthetic capability, and dominate other plants in this ecosystem to obtain sunlight. Even in smaller numbers, primary producers in forests are still capable of supporting other trophic levels.
Another way to visualize ecosystem structure is with pyramids of biomass. This pyramid measures the amount of energy converted into living tissue at the different trophic levels. Using the Silver Springs ecosystem example, this data exhibits an upright biomass pyramid (Figure 16.7A), whereas the pyramid from the English Channel example is inverted.
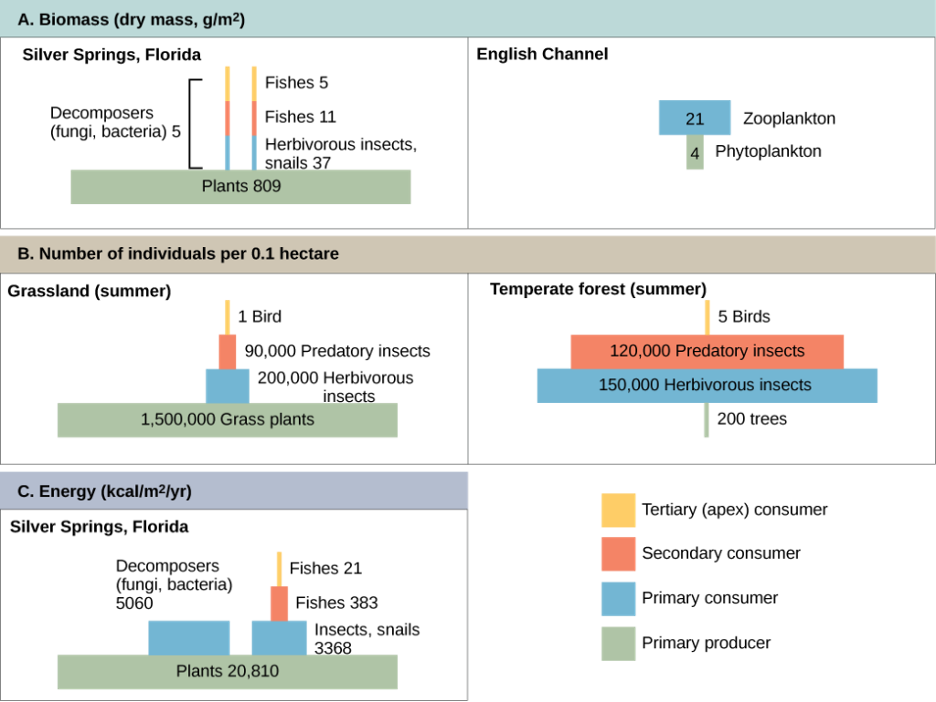
The plants (primary producers) of the Silver Springs ecosystem make up a large percentage of the biomass found there. However, the phytoplankton in the English Channel example make up less biomass than the primary consumers, the zooplankton. As with inverted pyramids of numbers, this inverted pyramid is not due to a lack of productivity from the primary producers, but results from the high turnover rate of the phytoplankton. The phytoplankton are consumed rapidly by the primary consumers, thus, minimizing their biomass at any particular point in time. However, phytoplankton reproduce quickly, thus they are able to support the rest of the ecosystem.
Pyramid ecosystem modeling can also be used to show energy flow through the trophic levels. Notice that these numbers are the same as those used in the energy flow compartment diagram in Figure 16.6. Pyramids of energy are always upright, and an ecosystem without sufficient primary productivity cannot be supported. All types of ecological pyramids are useful for characterizing ecosystem structure. However, in the study of energy flow through the ecosystem, pyramids of energy are the most consistent and representative models of ecosystem structure (Fig 16.7).
Pyramids of organisms may be inverted or diamond-shaped because a large organism, such as a tree, can sustain many smaller organisms. Likewise, a low biomass of organisms can sustain a larger biomass at the next trophic level because the organisms reproduce rapidly and thus supply continuous nourishment. Energy pyramids, however, must always be upright because of the laws of thermodynamics. The first law of thermodynamics states that energy can neither be created nor destroyed; thus, each trophic level must acquire energy from the trophic level below. The second law of thermodynamics states that, during the transfer of energy, some energy is always lost as heat; thus, less energy is available at each higher trophic level.
Reading Question #5
Which of the following values can be greater at higher trophic levels?
A. Number of individuals
B. Biomass
C. Energy
D. A and B only
E. A, B, and C
Research into Ecosystem Dynamics: Ecosystem Experimentation and Modeling
The study of the changes in ecosystem structure caused by changes in the environment (disturbances) or by internal forces is called ecosystem dynamics. Ecosystems are characterized using a variety of research methodologies. Some ecologists study ecosystems using controlled experimental systems, while some study entire ecosystems in their natural state, and others use both approaches.
A holistic ecosystem model attempts to quantify the composition, interaction, and dynamics of entire ecosystems; it is the most representative of the ecosystem in its natural state. A food web is an example of a holistic ecosystem model. However, this type of study is limited by time and expense, as well as the fact that it is neither feasible nor ethical to do experiments on large natural ecosystems. It is difficult to quantify all different species in an ecosystem and the dynamics in their habitat, especially when studying large habitats such as the Amazon Rainforest.
For these reasons, scientists study ecosystems under more controlled conditions. Experimental systems usually involve either partitioning a part of a natural ecosystem that can be used for experiments, termed a mesocosm, or by recreating an ecosystem entirely in an indoor or outdoor laboratory environment, which is referred to as a microcosm. A major limitation to these approaches is that removing individual organisms from their natural ecosystem or altering a natural ecosystem through partitioning may change the dynamics of the ecosystem. These changes are often due to differences in species numbers and diversity and also to environment alterations caused by partitioning (mesocosm) or recreating (microcosm) the natural habitat. Thus, these types of experiments are not totally predictive of changes that would occur in the ecosystem from which they were gathered. As both of these approaches have their limitations, some ecologists suggest that results from these experimental systems should be used only in conjunction with holistic ecosystem studies to obtain the most representative data about ecosystem structure, function, and dynamics.
Scientists use the data generated by these experimental studies to develop ecosystem models that demonstrate the structure and dynamics of ecosystems. They use three basic types of ecosystem modeling in research and ecosystem management: a conceptual model, an analytical model, and a simulation model. A conceptual model is an ecosystem model that consists of flow charts to show interactions of different compartments of the living and nonliving components of the ecosystem. A conceptual model describes ecosystem structure and dynamics and shows how environmental disturbances affect the ecosystem; however, its ability to predict the effects of these disturbances is limited. Analytical and simulation models, in contrast, are mathematical methods of describing ecosystems that are indeed capable of predicting the effects of potential environmental changes without direct experimentation, although with some limitations as to accuracy. An analytical model is an ecosystem model that is created using simple mathematical formulas to predict the effects of environmental disturbances on ecosystem structure and dynamics. A simulation model is an ecosystem model that is created using complex computer algorithms to holistically model ecosystems and to predict the effects of environmental disturbances on ecosystem structure and dynamics. Ideally, these models are accurate enough to determine which components of the ecosystem are particularly sensitive to disturbances, and they can serve as a guide to ecosystem managers (such as conservation ecologists or fisheries biologists) in the practical maintenance of ecosystem health.
References
Adapted from
Clark, M.A., Douglas, M., and Choi, J. (2018). Biology 2e. OpenStax. Retrieved from https://openstax.org/books/biology-2e/pages/1-introduction
and
Lumen Learning. Fundamentals of Biology I. PressBooks. Retrieved from https://library.achievingthedream.org/herkimerbiologyfundamentals1/
and
Various authors. Introductory Biology: Evolutionary and Ecological Perspectives. Retrieved from https://pressbooks.umn.edu/introbio/
position of a species or group of species in a food chain or a food web
trophic level that obtains its energy from sunlight, inorganic chemicals, or dead and/or decaying organic material
trophic level that obtains its energy from the primary producers of an ecosystem
usually a carnivore that eats primary consumers
carnivore that eats other carnivores
organism at the top of the food chain
graphic representation of a holistic, nonlinear web of primary producers, primary consumers, and higher-level consumers used to describe ecosystem structure and dynamics
type of food web in which the primary producers are either plants on land or phytoplankton in the water; often associated with a detrital food web within the same ecosystem
type of food web in which the primary consumers consist of decomposers; these are often associated with grazing food webs within the same ecosystem
organisms that break down organic material, such as fungi, protozoa, and bacteria
organisms that consume detritus, that is, organic matter from dead organisms
a series of reactions occurring in the chloroplast that features carbon dioxide and water as reactants, and glucose and oxygen as products
a process in which organisms obtain nutrition and food by relying on chemical energy from chemical reactions. Compare this to photosynthesis, which relies on light energy from the sun.
use of a nutritional source (eating)
organism that consumes organic substances or other organisms for food
organisms that can produce their own food starting from inorganic carbon
organism capable of producing its own organic compounds from sunlight
organisms that can build organic molecules using energy derived from inorganic chemicals instead of sunlight
rate at which photosynthetic primary producers incorporate energy from the sun
energy that remains in the primary producers after accounting for the organisms’ respiration and heat loss
increasing concentrations of persistent, toxic substances in organisms at each trophic level, from the primary producers to the apex consumers
rate at which biomass generation occurs at in an ecosystem
energy transfer efficiency between two successive trophic levels
measure of the ability of a trophic level to convert the energy it receives from the previous trophic level into biomass
(also known as an Eltonian pyramid) graphical representation of different trophic levels in an ecosystem based of organism numbers, biomass, or energy content
portion of a natural ecosystem to be used for experiments
re-creation of natural ecosystems entirely in a laboratory environment to be used for experiments
