
8 Chapter 8: Reading Phylogenetic Trees
Anastasia Chouvalova and Lisa Limeri
Learning Objectives
By the end of this section, students will be able to…
- Identify the following on a given phylogenetic tree: branch, internal node, root, tip, monophyletic groups of taxa, outgroup.
- Identify the most recent common ancestor of a pair of taxa and evaluate the degree of relatedness among taxa on a phylogenetic tree.
Introduction to Phylogenies
Biologists strive to understand the evolutionary history and relationships of living organisms. Phylogeny is the evolutionary history and relationship of an organism or group of organisms. A phylogeny describes the organism’s relationships, such as from which organisms it may have evolved, or to which species it is most closely related. Phylogenetic relationships provide information on shared ancestry but not necessarily on how organisms are similar or different.
Evolutionary biologists could list many reasons why understanding phylogeny is important to everyday life in human society. For botanists, phylogeny acts as a guide to discovering new plants that can be used to benefit people. Think of all the ways humans use plants—food, medicine, and clothing are a few examples. If a plant contains a compound that is effective in treating cancer, scientists might want to examine all of the compounds for other useful drugs.
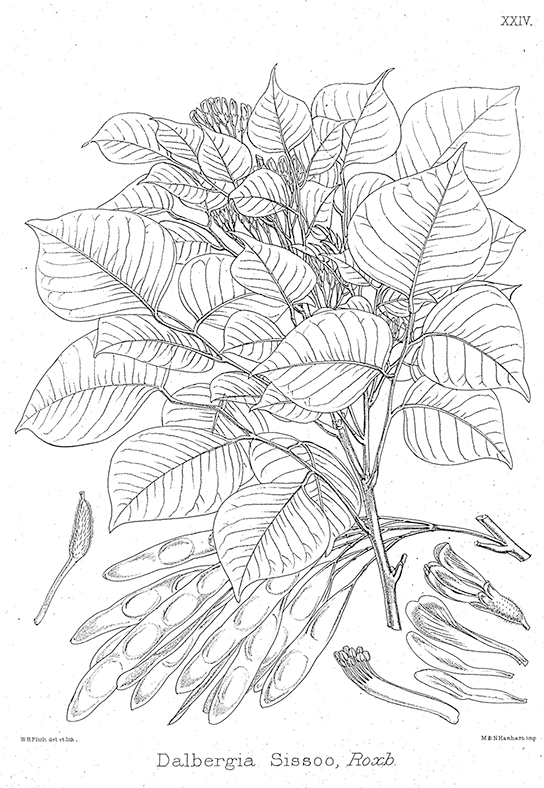
A research team in China identified a DNA segment that they thought to be common to some medicinal plants in the family Fabaceae (the legume family). They worked to identify which species had this segment (Fig 9.1). After testing plant species in this family, the team found a DNA marker (a known location on a chromosome that enabled them to identify the species) present. Then, using the DNA to uncover phylogenetic relationships, the team could identify whether a newly discovered plant was in this family and assess its potential medicinal properties.
Reading Question #1
What information does a phylogeny include?
A. Which lineage a currently-living species evolved from.
B. Shared ancestry among currently-living groups.
C. How similar organisms appear.
D. A and B
E. A, B, and C
Phylogenetic Trees
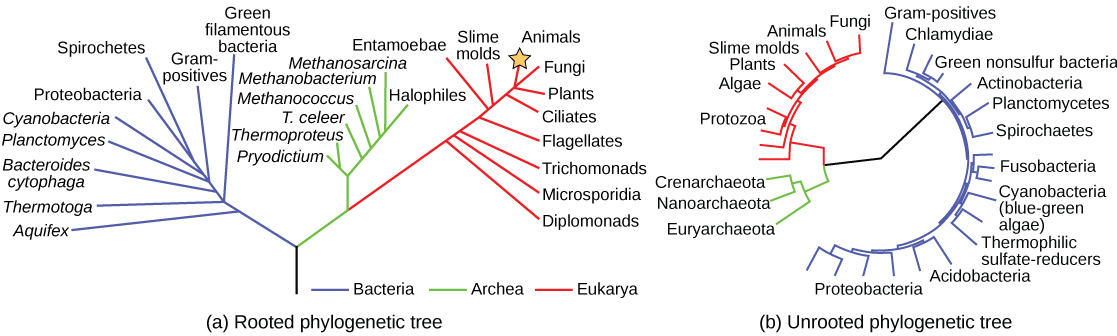
Scientists use a type of model called a phylogenetic tree to show the evolutionary pathways and connections among organisms. A phylogenetic tree is a diagram used to reflect evolutionary relationships among organisms or groups of organisms (Fig 9.2). Scientists consider phylogenetic trees to be a hypothesis of the evolutionary past since one cannot go back to confirm the proposed relationships. Many phylogenetic trees have a single lineage at the base representing a common ancestor. Scientists call such trees rooted, which means there is a single ancestral lineage (typically drawn from the bottom or left) to which all organisms represented in the diagram relate. Notice in the rooted phylogenetic tree that the three domains— Bacteria, Archaea, and Eukarya—diverge from a single point and branch off (Fig 9.2A). The small branch that plants and animals (including humans) occupy in this diagram shows how recent and miniscule these groups are compared with other organisms. Unrooted trees do not show a common ancestor but do show relationships among species (Fig 9.2B).
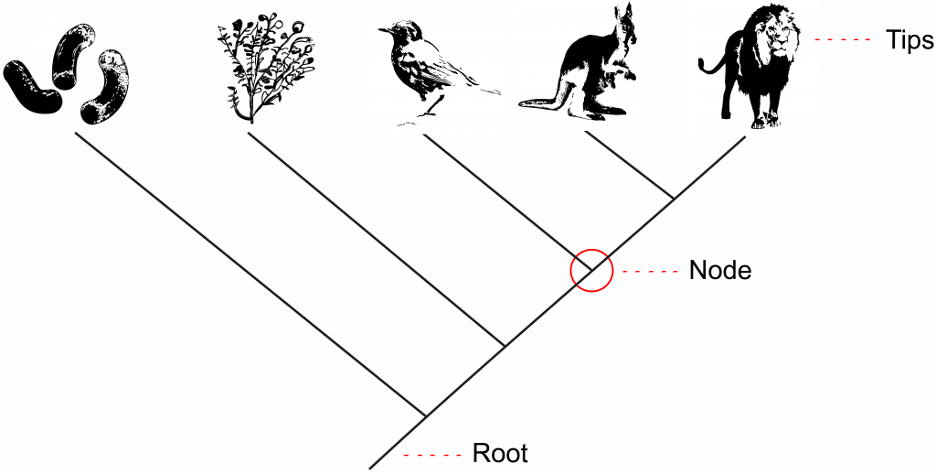
The tips of the branches depict the current-day taxa that are the subject of the phylogenetic tree (Fig 9.3). A taxon (plural: taxa) is a broad term used for any group or rank in a biological classification into which related organisms are classified. Taxa at the tips of phylogenetic trees could be sub-species, species, genera, families, phyla, et. cetera – any level of biological grouping that is the focus of the phylogenetic tree. Each branching point, called a node, is the point at which a single taxon, such as a species, separates into two or more species – a.k.a speciation (Fig 9.3). In a phylogenetic tree, closely related organisms are joined by nodes. These nodes suggest common ancestry. We call two taxa stemming from the same most recent node sister taxa. In Figure 9.3 below, the kangaroo and lion are sister taxa because they are the two tips stemming from the most recent node.
An important key to interpreting phylogenetic tree structure is to recognize that branch points could be rotated without changing the information. For example, if a branch point rotated and the taxon order changed, this would not alter the information because each taxon’s evolution from the branch point was independent of the other. This means that in Figure 9.3 above, we could rotate the node between the lion and kangaroo, switching the location of the lion and kangaroo, and it would still depict the same information.
As shown in the trees below (Fig 9.4), it’s possible to rotate branches around nodes without changing the evolutionary relationships depicted. This has the effect of changing the order of terminal taxa, but not changing the information that the tree conveys. Imagine the phylogenetic tree as a child’s mobile hanging from its root. As the wind blows and the mobile rotates, which branches are adjacent to one another may change, but the fundamental connections on the tree (the patterns of shared ancestry) do not. When faced with a tree that lends itself to notions of progress or other misconceptions, try rotating a few branches. Often, that exercise will demonstrate that a misleading interpretation must be wrong!

We can trace the pathway from the origin of life to any individual species by navigating through the evolutionary branches between the two points. Also, by starting with a single species and tracing back towards the “trunk” of the tree, one can discover species’ ancestors, as well as where lineages share a common ancestry.
Reading Question #2
Where are currently-living species depicted on a phylogenetic tree?
A. Root
B. Tip
C. Node
D. Branch
Reading Question #3
What does a node in a phylogenetic tree represent?
A. Convergent evolution
B. The evolution of an ancestral trait
C. A speciation event
D. A species going extinct
Evaluating relatedness of taxa on trees
The branching pattern of a tree indicates relatedness; taxa that share more recent common ancestors are more closely related. It’s tempting to think that terminal taxa that are located more closely to one another on a phylogeny are more closely related evolutionarily, but this is not the way that it works. Study the tree below (Figure 9.5). The circle and star taxa are adjacent to one another, but their most recent common ancestor is actually near the base of the tree. The star and rectangle taxa are actually much more closely related than the circle and star taxa are because the star’s and rectangle’s most recent common ancestor is younger and occurs nearer the tips of the tree!

It is important to remember that trees depict evolutionary relationships, not evolutionary progress. It’s easy to think that taxa that appear near one side of a phylogenetic tree are more advanced than other organisms on the tree, but this is simply not the case. First, the idea of evolutionary “advancement” is not a particularly scientific idea. There is no unbiased, universal scale for “advancement.” Second, taxa with extreme versions of traits (which might be perceived as more “advanced”) may occur on any terminal branch. The position of a terminal taxon is not an indication of how adaptive, specialized, or extreme its traits are.
Reading Question #4
What determines the evolutionary relatedness of two taxa?
A. How many traits they share in common.
B. How recently they shared a common ancestor.
C. The location of the tips on the phylogenetic tree.
D. How many chromosomes they share.
Monophyletic and Paraphyletic Groups
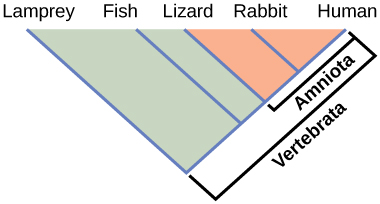
Phylogenies help us group organisms in evolutionarily meaningful ways. Clades also called monophyletic groups, are groups of organisms that descended from a single ancestor. For example, in Figure 9.4, all the organisms in the orange region evolved from a single ancestor that had amniotic eggs. Consequently, these organisms also have amniotic eggs and make a single clade, or a monophyletic group, called the Amniota. Clades must include all descendants from a branch point. Thus, rabbits and lizards would not make a clade because the most recent ancestor they have in common (the base of the Amniota) also includes humans as one of their descendants (Figure 9.5).
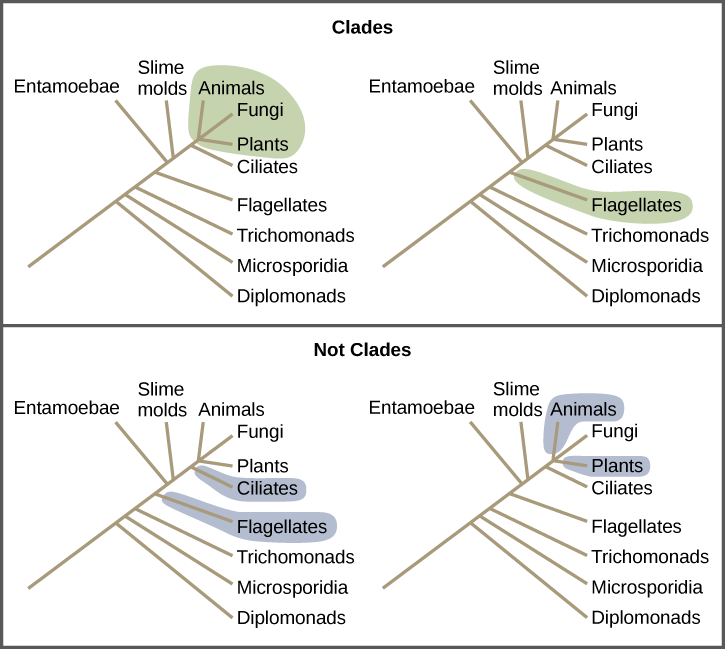
Clades can vary in size depending on which branch point one references. The important factor is that all organisms in the clade or monophyletic group stem from a single point on the tree. You can remember this because monophyletic breaks down into “mono,” meaning one, and “phyletic,” meaning evolutionary relationship. Figure 9.6 shows various clade examples. Notice how each clade comes from a single point; whereas, the non-clade groups, also called paraphyletic groups, show branches that do not share a single point.
Reading Question #5
What distinguishes a monophyletic group from a paraphyletic group?
A. The evolutionary relatedness of the taxa in the group
B. Which evolutionary forces acted on the group
C. The similarity of traits in the group
D. The terms are synonyms
Building Phylogenetic Trees
Organizing the evolutionary relationships of all life on Earth is a very challenging task: scientists must span enormous blocks of time and work with information from long-extinct organisms. Trying to decipher the proper connections, especially given the presence of homologies and analogies, makes the task of building an accurate tree of life extraordinarily difficult. Advancing DNA technology provides large quantities of genetic sequences for researchers to use and analyze.
To aid in the tremendous task of describing phylogenies accurately, scientists often use the concept ofmaximum parsimony, which means defaulting to the assumption that events occurred in the simplest, most obvious way. In the context of building phylogenetic trees, this means that the most probable series of events is the one that includes the fewest major evolutionary events/changes. Starting with all of the homologous traits in a group of organisms, scientists look for the most obvious and simple order of evolutionary events that led to the occurrence of those traits. In other words, if two organisms have a trait in common, it’s more likely that it evolved once and those two organisms share ancestry, rather than the trait evolving twice from separate ancestors.
Link to Learning
Head to this website to learn how researchers use maximum parsimony to create phylogenetic trees.
References
Adapted from Clark, M.A., Douglas, M., and Choi, J. (2018). Biology 2e. OpenStax. Retrieved from https://openstax.org/books/biology-2e/pages/1-introduction
Adapted from MacDonald, T. & Thanukos, A. (2021). Tips for Tree Reading. Understanding Evolution. Retrieved from https://evolution.berkeley.edu/the-tree-room/evolutionary-trees-a-primer/tips-for-tree-reading/
evolutionary history and relationship of an organism or group of organisms
diagram that reflects the evolutionary relationships among organisms or groups of organisms
(plural: taxa) single level in the taxonomic classification system
a point representing branching from an ancestral population
two lineages that diverged from the same branch point
also known as monophyletic groups, a clade consists of organisms that share a single ancestor
also known as clades, that is, organisms sharing a common ancestor
a group of organisms originating from one common ancestor but does not contain ALL of the ancestor's descendants. Compare this to monophyletic groups, which does contain ALL of the common ancestor's descendants. Refer to Figure 7.5 for an illustration.
applying the simplest, most obvious way with the least number of steps
