
11 Chapter 11: Ecology and Biodiversity
Mason Tedeschi; Anastasia Chouvalova; and Lisa Limeri
Learning Objectives
By the end of this section, students will be able to…
- Create a diagram explaining the nested relationships among populations, species, communities, and ecosystems.
- Explain how biologists measure biodiversity and how species richness differs from species diversity.
- Describe the pattern and potential explanatory factors of the latitudinal gradient in biodiversity.
Introduction to Ecology
Ecology is the study of the interactions among living organisms and with their environment. One core goal of ecology is to understand the distribution and abundance of living things in the physical environment.
Levels of Ecological Study
When a discipline such as biology is studied, it is often helpful to subdivide it into smaller, related areas. For instance, cell biologists interested in cell signaling need to understand the chemistry of the signal molecules (which are usually proteins) as well as the result of cell signaling. Ecologists interested in the factors that influence the survival of an endangered species might use mathematical models to predict how current conservation efforts affect endangered organisms.
To produce a sound set of management options, a conservation biologist needs to collect accurate data, including current population size, factors affecting reproduction (like physiology and behavior), habitat requirements (such as plants and soils), and potential human influences on the endangered population and its habitat (which might be derived through studies in sociology and urban ecology). Within the discipline of ecology, researchers work at four general levels, which sometimes overlap. These levels are organism, population, community, and ecosystem (Figure 13.1).

Organismal Ecology
Researchers studying ecology at the organismal level are interested in the adaptations that enable individuals to live in specific habitats. These adaptations can be morphological, physiological, and behavioral. For instance, the Karner blue butterfly (Lycaeides melissa samuelis) (Figure 13.2) is considered a specialist because the females only oviposit (lay eggs) on wild lupine (Lupinus perennis). This specific requirement and adaptation means that the Karner blue butterfly is completely dependent on the presence of wild lupine plants for its survival.

A researcher interested in studying Karner blue butterflies at the organismal level might, in addition to asking questions about egg laying requirements, ask questions about the butterflies’ preferred thoracic flight temperature (a physiological question), or the behavior of the caterpillars when they are at different larval stages (a behavioral question).
Population Ecology
A population is a group of interbreeding organisms that are members of the same species living in the same area at the same time. Organisms that are all members of the same species are called conspecifics. A population is identified, in part, by where it lives, and its area of population may have natural or artificial boundaries. Natural boundaries might be rivers, mountains, or deserts, while artificial boundaries may be mowed grass, manmade structures, or roads. The study of population ecology focuses on the number of individuals in an area and how and why population size changes over time.
For example, population ecologists are particularly interested in counting the Karner blue butterfly because it is classified as a federally endangered species. However, the distribution and density of this species is highly influenced by the distribution and abundance of wild lupine, and the biophysical environment around it. Researchers might ask questions about the factors leading to the decline of wild lupine and how these affect Karner blue butterflies. For example, ecologists know that wild lupine thrives in open areas where trees and shrubs are largely absent. In natural settings, intermittent wildfires regularly remove trees and shrubs, helping to maintain the open areas that wild lupine requires. Mathematical models can be used to understand how wildfire suppression by humans has led to the decline of this important plant for the Karner blue butterfly.
Community Ecology
A biological community consists of the different species within an area, typically a three-dimensional space, and the interactions within and among these species. Community ecologists are interested in the processes driving these interactions and their consequences. Questions about conspecific interactions often focus on competition among members of the same species for a limited resource. Ecologists also study interactions between various species; members of different species are called heterospecifics. Examples of heterospecific interactions include predation, parasitism, herbivory, competition, and pollination. These interactions can have regulating effects on population sizes and can impact ecological and evolutionary processes affecting diversity.
For example, Karner blue butterfly larvae form mutualistic relationships with ants (especially Formica species). Mutualism is a form of long-term relationship that has coevolved between two species and from which each species benefits. For mutualism to exist between individual organisms, each species must receive some benefit from the other as a consequence of the relationship. Researchers have shown that there is an increase in survival when ants protect Karner blue butterfly larvae (caterpillars) from predaceous insects and spiders, an act known as “tending.” This might be because the larvae spend less time in each life stage when tended by ants, which provides an advantage for the larvae. Meanwhile, to attract the ants, the Karner blue butterfly larvae secrete ant-like pheromones and a carbohydrate-rich substance that is an important energy source for the ants. Both the Karner blue larvae and the ants benefit from their interaction, although the species of attendant ants may be partially opportunistic and vary over the range of the butterfly.
Ecosystem Ecology
Ecosystem ecology is an extension of organismal, population, and community ecology. The ecosystem is composed of all the biotic components (living things) in an area along with the abiotic components (nonliving things) of that area. Some of the abiotic components include air, water, and soil. Ecosystem biologists ask questions about how nutrients and energy are stored and how they move among organisms and through the surrounding atmosphere, soil, and water.
The Karner blue butterflies and the wild lupine live in an oak-pine barren habitat. This habitat is characterized by natural disturbance and nutrient-poor soils that are low in nitrogen. The availability of nutrients is an important factor in the distribution of the plants that live in this habitat. Researchers interested in ecosystem ecology could ask questions about the importance of limited resources and the movement of resources, such as nutrients, though the biotic and abiotic portions of the ecosystem.
A biome refers to a major type of terrestrial (or aquatic) community distributed according to climate, which determines the predominant vegetation. In turn, the vegetation influences what types of animals can inhabit the area. Comparing the annual totals of precipitation and fluctuations in precipitation from one biome to another provides clues as to the importance of abiotic factors in the distribution of biomes. The same type of biome can occur in different areas of the world. The biosphere refers to all of the parts of Earth inhabited by life. The biosphere extends into the atmosphere (several kilometers above Earth) and into the depths of the oceans. Many abiotic forces influence where life can exist and the types of organisms found in different parts of the biosphere. The abiotic factors influence the distribution of biomes: large areas of land with similar climate, flora, and fauna.
Reading Question #1
Which of the following include abiotic components? Select all that apply.
A. Individual organism
B. Population
C. Community
D. Ecosystem
E. Biome
F. Biosphere
Introduction to Biodiversity
Biodiversity describes a community’s biological community. It is measured by the number of different species (species richness) in a particular area and their relative abundance (species evenness). The area in question could be a habitat, a biome, or the entire biosphere.
Despite considerable effort, knowledge of the species that inhabit the planet is limited. A recent estimate suggests that the eukaryote species for which science has names, about 1.5 million species, account for less than 20% of the total number of eukaryote species present on the planet (8.7 million species, by one estimate). Estimates of numbers of prokaryotic species are largely guesses, but biologists agree that science has only begun to catalog their diversity. Even with what is known, there is no central repository of names or samples of the described species; therefore, there is no way to be sure that the 1.5 million descriptions is an accurate number. It is a best guess based on the opinions of experts in different taxonomic groups. Estimates suggest that at the current rate of species description, which according to the State of Observed Species Report is 17,000 to 20,000 new species per year, it will take close to 500 years to finish describing life on this planet.
Measuring Biodiversity
There are a variety of ways to quantify and measure biodiversity. Species richness refers to the number of species present in an area. Important, species richness is a simple count of the number of species, and does not take into account the number of individuals of each species or relative abundance.
Relative species abundance is the number of individuals in a species relative to the total number of individuals in all species within a habitat, ecosystem, or biome. Foundation species (primary producers) often have the highest relative abundance of species.
The most commonly-used biodiversity measures take into account both species richness and relative species abundance. This is because richness alone does not account for the relative abundance of species. For example, in figure 13.3, both lakes have the same richness, but Lake B is more diverse because abundance is spread more evenly across the species present.

Simpson’s Index, developed in 1949 by Simpson, is a measure of probability–the less diversity, the greater the probability that two randomly selected individuals will be the same species. In the absence of diversity (1 species), the probability that two individuals randomly selected will be the same is 1. Simpson’s Index is calculated as follows:

where ni is the number of individuals in species i, N = total number of individuals of all species, and ni/N = pi (proportion of individuals of species i), and S = species richness. The value of Simpson’s D ranges from 0 to 1, with 0 representing infinite diversity and 1 representing no diversity, so the larger the value of D, the lower the diversity. For this reason, Simpson’s index is often as its complement (1-D).
Figure 13.4 below illustrates calculation of Simpson’s Index for Lakes A and B depicted in Figure 13.3:

Note that Simpson’s Index is often expressed (1-D), so the final answers are 0.29 and 0.8. This makes more intuitive sense: a higher D is more diverse–which is Lake B because it is less dominated by one species. (Credit)
Another widely used index of diversity that also considers both species richness and relative abundance is the Shannon-Weiner Diversity Index, originally proposed by Claude Shannon in 1948. It is also known as Shannon’s diversity index. The index is related to the concept of uncertainty. If for example, a community has very low diversity, we can be fairly certain of the identity of an organism we might choose by random (high certainty or low uncertainty). If a community is highly diverse and we choose an organism by random, we have a greater uncertainty of which species we will choose (low certainty or high uncertainty).

where pi = proportion of individuals of species i, and ln is the natural logarithm, and S = species richness. The value of H ranges from 0 to Hmax. Hmax is different for each community and depends on species richness.
Figure 13.5 below illustrates calculation of Shannon’s Diversity Index for Lakes A and B depicted in Figure 13.3:

Again, according to the Shannon-Weiner Index, Lake B is more diverse. (Credit)
Species evenness refers to how close in numbers each species in an environment is. So if there are 40 foxes and 1000 dogs, the community is not very even. But if there are 40 foxes and 42 dogs, the community is quite even. The evenness of a community can be represented by Pielou’s evenness index (Pielou 1966):

The value of J ranges from 0 to 1. Higher values indicate higher levels of evenness. At maximum evenness, J = 1.
Figure 13.6 below illustrates calculation of Pielou’s evenness index for Lakes A and B depicted in Figure 13.3:

Reading Question #2
What is the difference between species richness and species evenness
A. Species richness is a more accurate measure of biodiversity.
B. Species evenness is a more accurate measure of biodiversity.
C. Species richness only counts the number of species present while species evenness accounts for the relative abundance.
D. Species evenness only counts the number of species present while species richness includes the relative abundance.
Biodiversity over spatial scales
Whittaker (1972) described three terms for measuring biodiversity over spatial scales: alpha, beta, and gamma diversity. Alpha diversity refers to the diversity within a particular area or ecosystem, and is usually expressed by the number of species (i.e., species richness) in that ecosystem. For example, if we are monitoring the effect that British farming practices have on the diversity of native birds in a particular region of the country, then we might want to compare species diversity within different ecosystems, such as an undisturbed deciduous wood, a well-established hedgerow bordering a small pasture, and a large arable field. We can walk a transect in each of these three ecosystems and count the number of species we see; this gives us the alpha diversity for each ecosystem (Table 13.7).
If we examine the change in species diversity between these ecosystems then we are measuring the beta diversity. We are counting the total number of species that are unique to each of the ecosystems being compared. For example, the beta diversity between the woodland and the hedgerow habitats is 7 (representing the 5 species found in the woodland but not the hedgerow, plus the 2 species found in the hedgerow but not the woodland). Thus, beta diversity allows us to compare diversity between ecosystems (Table 13.7).
Gamma diversity is a measure of the overall diversity for the different ecosystems within a region. Hunter (2002: 448) defines gamma diversity as “geographic-scale species diversity.” In the example in Figure 13.7, the total number of species for the three ecosystems is 14, which represents the gamma diversity.

Reading Question #3
Match the terms to their definitions.
Terms: Species richness, Simpson’s Diversity Index, Shannon’s Diversity Index
Definitions:
A. The number of species present in an area.
B. The certainty that we can know of the identity of a randomly selected individual.
C. The probability that if you randomly select 2 individuals, they will be the same species.
Types of Biodiversity
Scientists generally accept that the term biodiversity describes the number and kinds of species in a location or on the planet. Species can be difficult to define, but most biologists still feel comfortable with the concept and are able to identify and count eukaryotic species in most contexts. Biologists have also identified alternate measures of biodiversity, some of which are important for planning how to preserve biodiversity.
Genetic diversity is one of those alternate concepts. Genetic diversity or variation is the raw material for adaptation in a species. A species’ future potential for adaptation depends on the genetic diversity held in the genomes of the individuals in populations that make up the species. The same is true for higher taxonomic categories. A genus with very different types of species will have more genetic diversity than a genus with species that look alike and have similar ecologies. If there were a choice between one of these genera of species being preserved, the one with the greatest potential for subsequent evolution is the most genetically diverse one. It would be ideal not to have to make such choices, but increasingly this may be the norm.
Many genes code for proteins, which in turn carry out the metabolic processes that keep organisms alive and reproducing. Genetic diversity can be measured as chemical diversity in that different species produce a variety of chemicals in their cells, both the proteins as well as the products and byproducts of metabolism. This chemical diversity has potential benefit for humans as a source of pharmaceuticals, so it provides one way to measure diversity that is important to human health and welfare.
Global biodiversity patterns
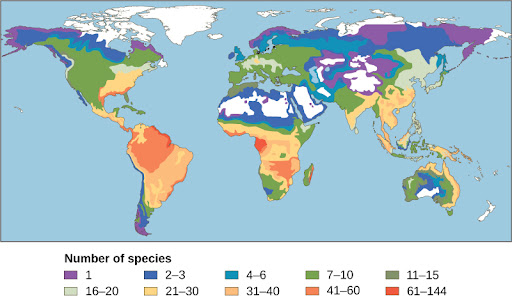
One of the oldest observed patterns in ecology is that species biodiversity in almost every taxonomic group increases as latitude declines. In other words, biodiversity increases closer to the equator (Fig 13.8). There are a number of hypotheses to explain why biodiversity increases closer to the equator. One of these hypotheses is the greater age of the ecosystems in the tropics versus temperate regions that were largely devoid of life or drastically impoverished during the last glaciation. The idea is that greater age provides more time for speciation. Another possible explanation is the increased energy the tropics receive from the sun versus the decreased energy that temperate and polar regions receive. A larger amount of solar energy at low latitudes supports a greater amount of plant biomass, which in turns supports larger numbers of individuals at higher trophic levels, allowing greater opportunity for more individuals belonging to more species. Another hypothesis is that the complexity of tropical ecosystems may promote speciation by increasing the heterogeneity, or number of ecological niches, in the tropics relative to higher latitudes. The greater heterogeneity provides more opportunities for coevolution, specialization, and perhaps greater selection pressures leading to population differentiation. However, this hypothesis suffers from some circularity—ecosystems with more species encourage speciation, but how did they get more species to begin with? Another hypothesis is that the tropics are more more stable than temperate regions, which have a pronounced climate and day-length seasonality. The tropics have their own forms of seasonality, such as rainfall, but they are generally assumed to be more stable environments and this stability might promote speciation.
Regardless of the mechanisms, it is certainly true that all levels of biodiversity are greatest in the tropics. Additionally, there are more endemic species in the tropics. Endemic species are species that are found in only one location. However, this richness of diversity in the tropics also means that knowledge of species is lowest, and there is a high potential for biodiversity loss.
In 1988, British environmentalist Norman Myers developed a conservation concept to identify areas rich in species and at significant risk for species loss: biodiversity hotspots. Biodiversity hotspots are geographical areas that contain high numbers of endemic species. The purpose of the concept was to identify important locations on the planet for conservation efforts, a kind of conservation triage. By protecting hotspots, governments are able to protect a larger number of species. The original criteria for a hotspot included the presence of 1500 or more endemic plant species and 70% of the area disturbed by human activity. There are now 34 biodiversity hotspots (Fig 13.9) containing large numbers of endemic species, which include half of Earth’s endemic plants.
Reading Question #4
What part of the world is home to the highest number of endemic species?
A. Oceanic environments
B. Freshwater environments
C. Tropical environments
D. Temperate environments
Reading Question #5
Where is biodiversity the highest for all taxa?
A. Near the equator
B. Near the poles
C. At high latitudes
D. In the ocean
The Importance of Biodiversity to Human Life
It may not be clear why biologists are concerned about biodiversity loss. When biodiversity loss is thought of as the extinction of the passenger pigeon, the dodo bird, and even the wooly mammoth, the loss may appear to be an emotional one. Biodiversity may provide important psychological benefits to humans. Additionally, there are moral arguments for the maintenance of biodiversity.
But is the loss practically important for the welfare of the human species? From the perspective of evolution and ecology, the loss of a particular individual species is unimportant (however, the loss of a keystone species can lead to ecological disaster). Extinction is a normal part of macroevolution. But the accelerated extinction rate means the loss of tens of thousands of species within our lifetimes, and it is likely to have dramatic effects on human welfare through the collapse of ecosystems and in added costs to maintain food production, clean air and water, and human health.
Agriculture began after early hunter-gatherer societies first settled in one place and heavily modified their immediate environment. This cultural transition has made it difficult for humans to recognize their dependence on undomesticated living things on the planet. Biologists recognize the human species is embedded in ecosystems and is dependent on them, just as every other species on the planet is dependent. Technology smoothes out the extremes of existence, but ultimately the human species cannot exist without its ecosystem.
Humans use many compounds that were first discovered or derived from living organisms as medicines: secondary plant compounds, animal toxins, and antibiotics produced by bacteria and fungi. More medicines are expected to be discovered in nature. Loss of biodiversity will impact the number of pharmaceuticals available to humans.
Crop diversity is a requirement for food security, and it is being lost. The loss of wild relatives to crops also threatens breeders’ abilities to create new varieties. Ecosystems provide ecosystem services that support human agriculture: pollination, nutrient cycling, pest control, and soil development and maintenance. Loss of biodiversity threatens these ecosystem services and risks making food production more expensive or impossible. Wild food sources are mainly aquatic, but few are being managed for sustainability. Fisheries’ ability to provide protein to human populations is threatened when extinction occurs.
The 6th Mass Extinction
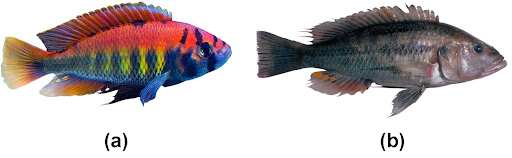
The Lake Victoria cichlids (Fig 13.10) provide an example through which we can begin to understand biodiversity. The biologists studying cichlids in the 1980s discovered hundreds of cichlid species representing a variety of specializations to particular habitat types and specific feeding strategies: eating plankton floating in the water, scraping and then eating algae from rocks, eating insect larvae from the bottom, and eating the eggs of other species of cichlid. The cichlids of Lake Victoria are the product of an adaptive radiation. An adaptive radiation is a rapid (less than three million years in the case of the Lake Victoria cichlids) branching through speciation of a phylogenetic tree into many closely related species; typically, the species “radiate” into different habitats and niches. The Galápagos finches are an example of a modest adaptive radiation with 15 species. The cichlids of Lake Victoria are an example of a spectacular adaptive radiation that includes about 500 species.
At the time biologists were making this discovery, some species began to quickly disappear. A culprit in these declines was a species of large fish that was introduced to Lake Victoria by fisheries to feed the people living around the lake. The Nile perch was introduced in 1963, but lay low until the 1980s when its populations began to surge. The Nile perch population grew by consuming cichlids, driving species after species to the point of extinction (the disappearance of a species). In fact, there were several factors that played a role in the extinction of perhaps 200 cichlid species in Lake Victoria: the Nile perch, declining lake water quality due to agriculture and land clearing on the shores of Lake Victoria, and increased fishing pressure. Scientists had not even catalogued all of the species present—so many were lost that were never named. The diversity is now a shadow of what it once was.
The cichlids of Lake Victoria are a thumbnail sketch of contemporary rapid species loss that occurs all over Earth and is caused by human activity. Extinction is a natural process of macroevolution that occurs at the rate of about one out of 1 million species becoming extinct per year. The fossil record reveals that there have been five periods of mass extinction in history with much higher rates of species loss, and the rate of species loss today is comparable to those periods of mass extinction. However, there is a major difference between the previous mass extinctions and the current extinction we are experiencing: human activity. Specifically, three human activities have a major impact: destruction of habitat, introduction of exotic species, and over-harvesting. Predictions of species loss within the next century, a tiny amount of time on geological timescales, range from 10-50%. Extinctions on this scale have only happened five other times in the history of the planet, and they have been caused by cataclysmic events that changed the course of the history of life in each instance. Earth is now in one of those times.
Lake Victoria contained almost 500 species of cichlids alone, ignoring the other fish families present in the lake. All of these species were found only in Lake Victoria; therefore, the 500 species of cichlids were endemic. Endemics with highly restricted distributions are particularly vulnerable to extinction. Higher taxonomic levels, such as genera and families, can also be endemic.
Career Connection: Biogeographer
Biogeography is the study of the distribution of the world’s species—both in the past and in the present. The work of biogeographers is critical to understanding our physical environment, how the environment affects species, and how environmental changes impact the distribution of a species; it has also been critical to developing evolutionary theory. Biogeographers need to understand both biology and ecology. They also need to be well-versed in evolutionary studies, soil science, and climatology.
There are three main fields of study under the heading of biogeography: ecological biogeography, historical biogeography (called paleobiogeography), and conservation biogeography. Ecological biogeography studies the current factors affecting the distribution of plants and animals. Historical biogeography, as the name implies, studies the past distribution of species. Conservation biogeography, on the other hand, is focused on the protection and restoration of species based upon known historical and current ecological information. Each of these fields considers both zoogeography and phytogeography—the past and present distribution of animals and plants.
References
Adapted from
Bynum, N. (2022) Biodiversity. LibreTexts. Retrieved from https://bio.libretexts.org/Bookshelves/Ecology/Biodiversity_(Bynum)
and
Clark, M.A., Douglas, M., and Choi, J. (2018). Biology 2e. OpenStax. Retrieved from https://openstax.org/books/biology-2e/pages/1-introduction
and
Lumen Learning. Fundamentals of Biology I. PressBooks. Retrieved from https://library.achievingthedream.org/herkimerbiologyfundamentals1/
and
Wilson, A. & Gownaris, N. Ecology for All! Retrieved from https://bio.libretexts.org/Courses/Gettysburg_College/01%3A_Ecology_for_All/22%3A_Biodiversity/22.02%3A_Diversity_Indices
variety of a biological system, typically conceived as the number of species, but also applying to genes, biochemistry, and ecosystems
organism with cells that have nuclei and membrane-bound organelles. Compare to prokaryote species.
number of different species in a community
absolute population size of a particular species relative to the population sizes of other species within the community
species diversity within a local scale, generally one ecosystem
ratio or difference in the diversity of a species between multiple ecosystems or communities
overall species diversity measured over many different ecosystems in a biome
species native to one place
concept originated by Norman Myers to describe a geographical region with a large number of endemic species and a large percentage of degraded habitat
disappearance of a species from Earth; local extinction is the disappearance of a species from a region
study of the geographic distribution of living things and the abiotic factors that affect their distribution
